EngageNY
Informally Fitting a Line
Discover how trend lines can be useful in understanding relationships between variables with a lesson that covers how to informally fit a trend line to model a relationship given in a scatter plot. Scholars use the trend line to make...
EngageNY
Determining the Equation of a Line Fit to Data
What makes a good best-fit line? In the 10th part of a 16-part module, scholars learn how to analyze trend lines to choose the best fit, and to write equations for best-fit lines to make predictions.
Willow Tree
Approximating a Line of Best Fit
You may be able to see patterns visually, but mathematics quantifies them. Here learners find correlation in scatterplots and write equations to represent that relationship. They fit a line to the data, find two points on the line, and...
West Contra Costa Unified School District
Correlation and Line of Best Fit
Computers are useful for more than just surfing the Internet. Pupils first investigate scatter plots and estimate correlation coefficients. Next, they use Microsoft Excel to create scatter plots and determine correlation coefficients and...
Curated OER
Animal Brains
Do big bodies make big brains? Let your learners decide whether there is an association between body weight and brain weight by putting the data from different animals into a scatterplot. They can remove any outliers and then make a line...
University of Texas
Matter and the Periodic Table Chemical Families and Periodic Trends
Is assembling the periodic table as simple as Tetris? Scholars arrange colored cards into a logical order and then make connections to the arrangement of the periodic table. Hands-on activities include adding trend arrows and analyzing...
Curated OER
Data Analysis, Probability, and Discrete Math: Line Graphs
Eighth graders analyze data from line graphs. They discuss the purpose of line graphs, identify the parts of a line graph, answer questions about various graphs, and complete a worksheet. This lesson includes a script to teach along with.
EngageNY
Using Linear Models in a Data Context
Practice using linear models to answer a question of interest. The 12th installment of a 16-part module combines many of the skills from previous lessons. It has scholars draw scatter plots and trend lines, develop linear models, and...
Curated OER
Musical Mystery Words
Students study the letter names for the treble clef and create words using the letters that represent the lines and spaces on the staff.
NASA
The Big Climate Change Experiment Lesson 3: Climate Change Lines of Evidence
Consider the preponderance of evidence when making a verdict. The third of five lessons in Unit 1: The Big Climate Change Experiment focuses on the evidence for climate change. Learners study graphs, diagrams, and pictures regarding...
Curated OER
Excel temperature Graphs
Learners gather data about the weather in Nome, Alaska. In this Nome Temperature lesson, students create an excel graph to explore the weather trends in Nome. Learners will find the average weather and add a trend line to their graph.
Curated OER
Interesting Integers
Upper elementary and middle schoolers practice solving addition and multiplication problems with positive and negative numbers. They use a number line initially to help find a solution.
Curated OER
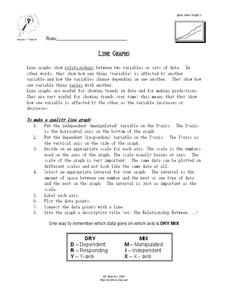
Line Graphs
In this algebra worksheet, students describe the relationship between a line graph and its data. They define the reasons line graphs are used and discuss increasing and decreasing lines. There is one involved questions, requiring several...
EngageNY
Patterns in Scatter Plots
Class members investigate relationships between two variables in the seventh installment of a 16-part module that teaches scholars how to find and describe patterns in scatter plots. Young mathematicians consider linear/nonlinear...
EngageNY
Scatter Plots
Scholars learn to create scatter plots and investigate any relationships that exists between the variables with a lesson that also show them that statistical relationships do not necessarily indicate a cause-and-effect relationship.
NASA
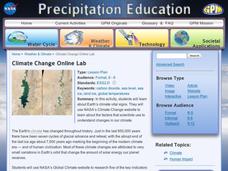
Climate Change Online Lab
What are the key indicators that show scientists that our planet is in the fastest warming trend ever? Learners go on a WebQuest to examine the evidence for themselves. Following several links to NASA sites, kids see how the global...
Curated OER
Climate Change
Students compare weather data and draw conclusions. In this climate change lesson plan, students determine whether data collected over a period of ninety years shows a warming trend.
Curated OER
Plate Tectonics
In this geology worksheet, learners will cut a map of California along the San Andreas fault line to see how California might change in the future. Then students will compare a world map from 50 million years in the future with a present...
Chicago Botanic Garden
Micro-GEEBITT Climate Activity
A truly hands-on and inquiry based learning activity bridges all the lessons in the series together. Beginning with a discussion on average global temperatures, young meteorologists use real-world data to analyze climate trends in order...
National Wildlife Federation
I Speak for the Polar Bears!
Climate change and weather extremes impact every species, but this lesson focuses on how these changes effect polar bears. After learning about the animal, scholars create maps of snow-ice coverage and examine the yearly variability and...
Curated OER
Polar Bears in Peril - Climate Change Culprit?
High schoolers explore the changes in sea ice over several years. In this life science lesson, students review and examine 20 years of data. They use Excel to graph data and analyze trends.
Curated OER
Chapter 34: Income Inequality and Poverty
Displaying the causes, trends, and effects of income inequality, this presentation covers the wide gap between wealth and poverty in the United States. The navigational tool will help lecturers guide the conversation. The key terms in...
Curated OER
Linear Regression and Correlation
Learners explore scatter plots. For this linear regression lesson, groups of pupils graph scatter plots and then find the line of best fit. They identify outliers and explain the correlation. Each group summarizes and shares their...
Curated OER
Hurricane Research
Young scholars examine the factors that influence hurricanes to develop. In this hurricane lesson students research atmospheric trends that affect hurricanes and create a summary.


