Curated OER
Practice Problems: Correlation and Linear Regression
In this correlation and linear regression worksheet, students examine data to determine the statistic mean. They compute the percent of the variability. This three-page worksheet contains 16 problems. Answers provided.
Shodor Education Foundation
Measures
Take a look at data from a statistical lens. An interactive allows pupils to enter data set, labeling the data including the units used. Manipulating the applet, learners select the statistics to calculate that include total, mean,...
Teach Engineering
Creepy Silly Putty
It might be silly to determine the creep rate of putty but groups will enjoy making different formulations of silly putty and playing with them to understand how the different mixtures behave. The second part of the activity has groups...
Teach Engineering
Preconditioning Balloons: Viscoelastic Biomedical Experiments
What does stretching a balloon have to do with equilibrium? Groups explore preconditioning by stretching a balloon to a point of equilibrium. They then measure the amount of force required to stretch the balloon to the same point several...
Federal Reserve Bank
Saving and Investing for the Long Term
Create savvy investors with an activity that uses an online resource to allow individuals to invest in the stock market. The teacher is able to track activity and progress. Stock tips and strategies are shared.
Radford University
Are We Normal?
Develop a sense of normal. Learners develop two questions to ask classmates to gather numerical data before creating a box and whisker plot and a histogram to display their data. Class members make inferences and investigate the data...
Curated OER
Introduction to Measurement
Student observes and measures the variability in the length of the forearm and the length of the foot and to test a common belief that the length of the foot is equal to the length of the forearm.
Curated OER
Global Temperatures
Students analyze the global temperature record from 1867 to the present. Long-term trends and shorter-term fluctuations are both evaluated. The data is examined for evidence of the impact of natural and anthropogenic climate forcing...
West Contra Costa Unified School District
Comparing Data Displays
There is so much more to data than just numbers, and this resource has learners use three methods of comparing data in a multi-faceted lesson. The 21-page packet includes a warm-up, examples, an activity, and assessment for a complete...
Curated OER
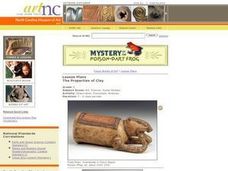
The Properties of Clay
Sixth graders determine the physical properties of clay by examining ceramic works of art. They evaluate local soil samples for suitability for sculpting and compare clay taken from soil to manufactured clay.
Mathematics Assessment Project
Mean, Median, Mode, and Range
What a find! Here is a lesson plan, designed to meet sixth grade math Common Core standards, that focuses on the calculation of different measures of center for the scores from a penalty shoot-out competition. An independent...
University of California
Artificially Selecting Dogs
Selective breeding has resulted in some novel and beautiful or useful dogs over the years. Using the American Foxhound as an example, genetics learners find out how and why they came about. Then, in small groups, they select breeds to...
Curated OER
Artificial Selection
The second lesson in the series begins with a starter activity discussing wild versus domesticated animals. Then, scholars play a card game, with optional variations, to emphasize artificial selection. Next, they attend a field trip to a...
EngageNY
Using Sample Data to Compare the Means of Two or More Populations II
The 23rd segment in a series of 25 presents random samples from two populations to determine whether there is a difference. Groups determine whether they believe there is a difference between the two populations and later use an...
EngageNY
Describing Distributions Using the Mean and MAD II
The 11th lesson in the series of 22 is similar to the preceding lesson, but requires scholars to compare distributions using the mean and mean absolute deviation. Pupils use the information to make a determination on which data set is...
EngageNY
Describing Distributions Using the Mean and MAD
What city has the most consistent temperatures? Pupils use the mean and mean absolute deviation to describe various data sets including the average temperature in several cities. The 10th lesson in the 22-part series asks learners to...
American Statistical Association
Step into Statastics
Class members study the size of classmates' feet and perform a statistical analysis of their data. They solve for central tendencies, quartiles, and spread for the entire group as well as subgroups. They then write a conclusion based on...
EngageNY
Distributions—Center, Shape, and Spread
Data starts to tell a story when it takes shape. Learners describe skewed and symmetric data. They then use the graphs to estimate mean and standard deviation.
Curated OER
Galaxy Hunter - A Cosmic Photo Safari
Space science stars journey through our night sky and take virtual photos of galaxies to investigate simple random samples. Higher math is used to analyze the data collected. Copy the evaluation/assessment questions onto a handout for...
Curated OER
Growing from Seed
High school or college horticulturists will appreciate this PowerPoint on seed-propagation. It walks them through the science behind seed production and germination as well as the requirements for growing plants from this stage....
EngageNY
Distributions and Their Shapes
What can we find out about the data from the way it is shaped? Looking at displays that are familiar from previous grades, the class forms meaningful conjectures based upon the context of the data. The introductory lesson to descriptive...
EngageNY
Mid-Module Assessment Task - Algebra 1 (module 2)
A mid-module assessment uses two multi-part questions to measure progress toward mastery on descriptive statistics standards. Each part of a question addresses a single standard to help determine mastery.
Noyce Foundation
Baseball Players
Baseball is all about statistics. Pupils solve problems related to mean, median, and range. They calculate the total weight of players given the mean weight, calculate the mean weight of reserve players given the mean weight of the...
Virginia Department of Education
Organizing Topic: Data Analysis
Learners engage in six activities to lead them through the process of conducting a thorough analysis of data. Pupils work with calculating standard deviations and z-scores, finding the area under a normal curve, and sampling techniques....
Other popular searches
- Measures of Variability
- Genetic Variability
- Proportion of Variability
- Random Variability
- Habitat Variability
- Climate Variability
- Statistical Variability
- Inherent Variability


