Curated OER
Bringing Climate Change Into the Classroom
Learners investigate the greenhouse effect and examine the potential effects of climate change in the Arctic. They construct a mini-greenhouse and test its effect on temperature, analyze historical climate statistics, and conduct an...
Curated OER
Weather and Climate Statistics
The investigation of weather, and climate is a fascinating study. For this lesson, learners see how weather and climate are actually two very different areas of study. They study printouts of an areas temperature highs, lows, and average...
Space Awareness
The Climate in Numbers and Graphs
Weather versus climate: weather relates to short time periods while climate averages the weather of a period of many years. Scholars learn about average temperature and precipitation in various climate zones and then apply statistics...
Curated OER
Climate Shifts
Eight slides of information related to shifts in the climate make up this presentation. The vocabulary and concepts displayed are geared toward high school meteorology learners. Content is not cohesive from slide to slide, but the...
Radford University
A Change in the Weather
Explore the power of mathematics through this two-week statistics unit. Pupils learn about several climate-related issues and complete surveys that communicate their perceptions. They graph both univariate and bivariate data and use...
Peace Corps
Weather and Water in Ghana
Students investigate the climate of their region. Students research statistics and conduct interviews. Students take a virtual tour of Ghana and discuss its climate. Students consider water conservation and the role it plays in both...
National Wildlife Federation
Stifling, Oppressive, Sweltering, Oh My!
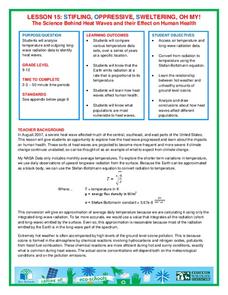
Looking for a hot date? Pick any day in August, statistically the hottest month in the United States. The 15th lesson in the series of 21 instructs pupils to investigate the August 2007 heat wave through NASA data, daily temperature...
Living Rainforest
Finding the Rainforests
From Brazil to Indonesia, young scientists investigate the geography and climate of the world's tropical rain forests with this collection of worksheets.
Curated OER
Going Local with Global Warming
Learners examine climate change by using recent temperature records. In this data analysis lesson plan students plot weather data and study the differences between weather and climate.
Curated OER
Canada's Climate: Temperature and Rainfall Variations
Middle schoolers analyze data about various climates in Canada. In this data analysis and climate instructional activity, students use Canada Year Book 1999 to complete a worksheet and make connections between precipitation and...
Curated OER
Comparing Temperatures and Latitudes
Eighth graders collect weather data from a variety of cities at the same latitudes, but on different continents. They organize data using spreadsheet program, generate graphs, and incorporate into a word processing document. Students...
Curated OER
Global Warming Statistics
Students research real-time and historic temperature data of U.S. and world locations, and analyze the data using mean, median, and mode averages. They graph the data and draw conclusions by analyzing the data. A spreadsheet is used to...
Curated OER
How Mountains Shape Climate
Pupils use raw data to make a climatograph; they explain the process of orographic precipitation and the concept of a rain shadow.
Curated OER
Creating Climographs
Students chart statistical information on graphs, interpret the information and use it to explain spatial relationships, and identify the relationship between climate and vegetation.
Curated OER
Under the Weather
Students consider the increase in floods. In this current events lesson, students visit selected websites to research the occurance of floods in Britain.
Curated OER
Zoo Poo
Students use Internet research to determine the amount of carbon dioxide produced per unit energy for biomass and coal. In this alternative energy lesson, students research to find out how much energy and carbon dioxide several coal and...
Curated OER
Linking Algebra to Temperature
Students convert between two units as they calculate the temperature. In this algebra lesson, students collect data on seasonal climate and create a graph. They make conjectures based on their data collection.
Curated OER
Standard Deviation
Students find city temperatures and analyze their means to find the standard deviation. They calculate the standard deviation of monthly temperature means.


