Curated OER
Census Statistics and Graphing
Learners graphically represent data from the Census. In this middle school mathematics lesson, students investigate the housing characteristics of different tribes of Native Americans and compare them to the average American...
Curated OER
Mean and Median
Students identify the different central tendencies. In this probability lesson, students create the correct type of graphs to analyze their data. They make predictions and draw conclusions from their data.
Curated OER
Drops on a Penny
Eighth graders experiment to determine the number of drops of water a heads up penny hold. They create a stem and leaf graph of the class results and use the data for further experimentation on a tails up penny.
Curated OER
Environmental Mathematics
Eighth graders determine food that they would need to survive in the wild. They graph the best foods for their environments and rate the survivability rate for each member of their group.
Curated OER
Remembering Our Veterans Data Management Project
Seventh graders utilize data collected from various sources based on Canadian military statistics to consolidate their understanding of data management. Students plan and create a PowerPoint presentation using this data including in...
Curated OER
Data Shuffle
Students find an advertisement or newspaper using charts or graphs. They create another graph using the same information in a different format. They write a comparison of the two graphs.
Curated OER
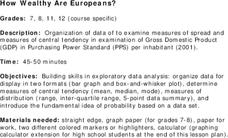
How Wealthy Are Europeans?
Students investigate measures of central tendency. They examine compiled data and conduct critical analysis. The graph is focusing on the gross domestic product data. The lesson also reviews the concept of putting values in order of...
Curated OER
Histograms and Frequency Tables
In this statistics worksheet, students solve and analyze graphs. They use histograms and frequency tables to solve their problems. There are 2 multiple choice questions with an answer key.
Khan Academy
Khan Academy: Creating Box Plots
More practice making box plots to summarize data sets. Students receive immediate feedback and have the opportunity to try questions repeatedly, watch a video or receive hints.
Khan Academy
Khan Academy: Reading Box Plots
Practice reading information presented in box plots. Students receive immediate feedback and have the opportunity to try questions repeatedly, watch a video or receive hints.
Shodor Education Foundation
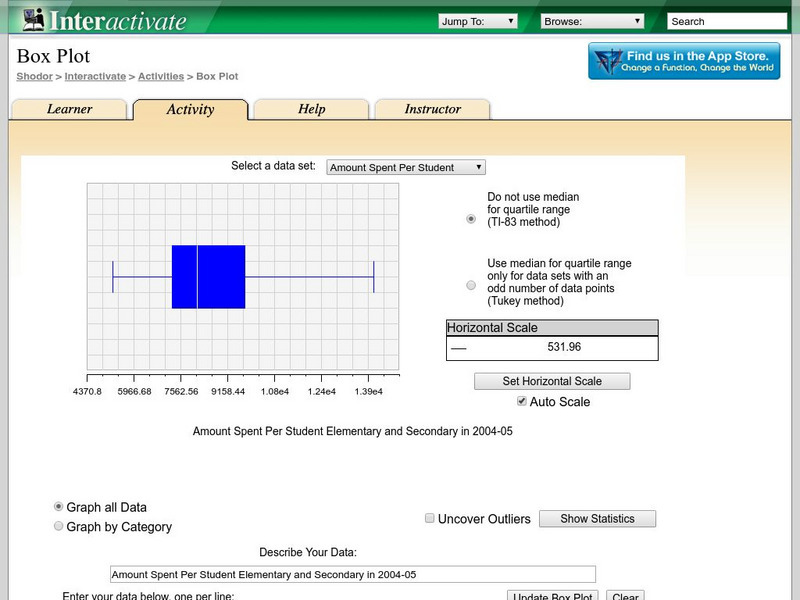
Shodor Interactivate: Box Plot
Students learn about box-and-whisker plots. The interactive box plot allows the user to explore maximum, minimum, median, upper quartile, lower quartile, and outliers.
Annenberg Foundation
Annenberg Learner: Drawing a Box Plot
Learn how to represent the Five-Number Summary graphically using a box plot.
Better Lesson
Better Lesson: Box and Whiskers Activity
The students will be working in stations to construct and analyze box plots. All activities are of high interest and rich in content.
Richland Community College
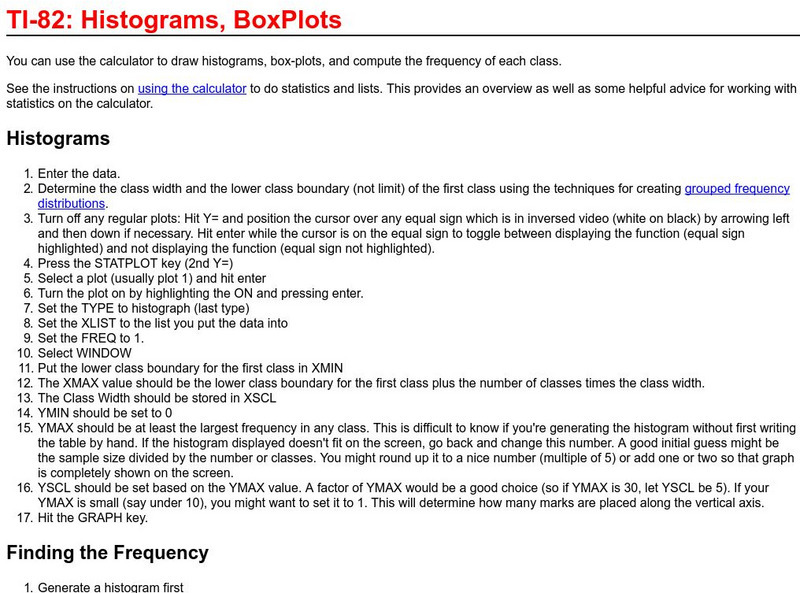
Richland College: Ti 82 Histograms / Box Plots
Richland College provides a step-by-step procedure on how to use a TI-82 to construct histograms and box plots and then use this to find frequency distribution.
Texas Instruments
Texas Instruments: How Tall? Describing Data With Statistical Plots
In this activity, students' will measure their heights using a motion detector and describe the data using the statistical concept called box plot.
Shodor Education Foundation
Shodor Interactivate: Lesson: Algorithm Discovery With Venn Diagrams
The lesson plan, with objectives, lesson outline, and interactive resources, helps students learn about algorithms using box plots and Venn diagrams.
Better Lesson
Better Lesson: Box and Whiskers... Analyzing and Creating
The students will be using discovery techniques to learn about box and whisker plots.
Math Planet
Math Planet: Stem and Leaf Plots and Box and Whiskers Plot
Discover how to use stem-and-leaf plots and box-and-whisker plots to visualize data by taking a look at examples and a video lesson.
Texas Instruments
Texas Instruments: Get on the Stick
In this activity, students use a CBR 2 to measure the reaction time of catching a stick. They also learn how to interpret a box plot, and make a five number summary of a single variable data set.
University of Georgia
University of Georgia: Inter Math: Box and Whisker Plot
Description of box-and-whisker plots and their uses, along with a visual representation. There are links to related terms, everyday examples, more information, and the interactive checkpoint involving box and whisker plots located in the...
Texas Instruments
Texas Instruments: Box and Whiskers
Lesson engages participants in various activities designed to enhance the learners understanding of box and whiskers graphs in various formats.
Texas Instruments
Texas Instruments: Create Box and Whisker Plots
Students use a graphing calculator to create box-and-whisker plots and learn the usefulness of them. Students identify the five summary statistical values of data sets - minimum, first quartile, median, third quartile, and maximum values.
Texas Instruments
Texas Instruments: Mc Dougal Littell Algebra 1: Box and Whisker Plots
Students will make a box-and-whisker plot and list the first, second, and third quartiles.
Purple Math
Purplemath: Quartiles, Boxes, and Whiskers
Explains how to construct a simple box-and-whisker plot, and demonstrates the steps. Discusses quartiles and medians, shows how to find them, and explains how they relate to box-and-whisker plots.
Other popular searches
- Box and Whisker Plots
- Box Whisker Plots
- Box and Whisker Plots
- Box & Whisker Plot
- Box and Whisker Plot Es
- Box and Whisker Plots
- Box and Whisker Plotes
- Double Box and Whisker Plots
- Box Ans Whisker Plot


