Granite School District
6th Grade CCSS Math Vocabulary Word List
Simplify the Common Core Math Standards for sixth graders with this comprehensive list of key vocabulary. Complemented by a series of word cards that support the meaning of each term with images and examples, this resource provides...
Curated OER
Box Plots
Young statisticians are introduced to box plots and quartiles. They use an activity and discussion with supplemental exercises to help them explore how data can be graphically represented.
Curated OER
Leveled Problem Solving: Range and Outliers
In this range and outliers learning exercise, students solve 6 word problems where they examine data then identify outliers, find the upper and lower quartile ranges, find the interquartile range and create box-and-whisker plots.
American Statistical Association
Step into Statastics
Class members study the size of classmates' feet and perform a statistical analysis of their data. They solve for central tendencies, quartiles, and spread for the entire group as well as subgroups. They then write a conclusion based on...
Curated OER
Scatterplots
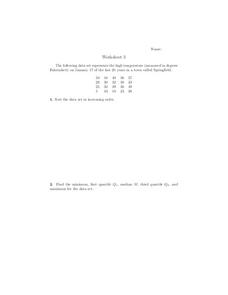
In this scatterplots worksheet, 9th graders solve and complete 6 different word problems with different sets of data. First, they sort the data set in increasing order and find the minimum, first quartile, median, third quartile, and...
Curated OER
Box Plots
Students review the concept of median, explore how to calculate quartiles for any size data set and experience how to build a box plot.
Curated OER
Boxplots Introduction
Students describe the pattern of a bell curve graph. In this statistics lesson, students move data around and make observation about the mean, and the quartiles. They define boxplot, outlier, range and other important vocabulary words...
Curated OER
Business & Statistics: Final Exam
In this business and statistics worksheet, students read real-life business problems, arrange data, and identify the probability method best used to determine the answer. They identify the type of random sample, draw stem-and-leaf plots,...
Curated OER
Sampling Distribution and Estimators Section 6.4
In this distribution worksheet, pupils examine given situations, determine the probability of an event, identify the standard deviation, and find a specified percentile and quartiles. Five probability story problems are available on this...
Curated OER
Frequency Tables
Seventh graders construct frequency tables and box-and-whisker plots. After constructing tables and plots, they take a quiz on mean, median, mode, range, scientific notation, and number properties.
Curated OER
What is a Box and Whisker Plot?
Eighth graders explore the correct use of box and whisker plors. The times when they are appropriate to use to compare data is covered. They plot data according to statistical analysis including mean, median, and mode.
Curated OER
What Are The Chances
Students calculate the probability of an event occurring. In this probability lesson, students differentiate between independent, dependent or compound events. They find the range of the data.
Curated OER
How Wealthy Are Europeans?
Students investigate measures of central tendency. They examine compiled data and conduct critical analysis. The graph is focusing on the gross domestic product data. The lesson also reviews the concept of putting values in order of...


