Curated OER
Census Data and New Hampshire History
Students graph the population growth of New Hampshire using historical census data.
Curated OER
Graphing the Daily Revenue of Miami Seaquarium
Seventh graders compile a table of the revenues of the 8 eateries (a combined total), Main Gate admissions, and the Gift Shop.
Curated OER
Surveying During a Basketball Game
Tenth graders conduct a survey at a high school basketball game. They compile and present the data as histograms or bar graphs.
Curated OER
Basketball And Mathematics
Eighth graders collect and analyze data about foul shots taken at basketball games.
Curated OER
Deer Tracks
Students use satellite images to track to movement patterns of deer and examine deer behavior. They write stories about a day in the life of a field scientist.
Curated OER
Name Count and Graph
Learners find the frequency of a name in selected states by using the Internet. They input data into a spread sheet. They create a graph that illustrates the gathered information.
Curated OER
Ring Around the Rosie
Young scholars work together to discover the concept of angular momentum. They participate in experiments in which they test rotation and relate it to an object's mass. They participate in a literacy activity in which they compare...
Curated OER
Trends in Precipitation
Eighth graders study about precipitation and graph the information. They look for patterns in a scatter graph and make inferences based on what they see. They need to see a relationship between location and the amount of precipitation.
Curated OER
Investigating the Idea of Tan
Fifth graders use tan to solve problems involving right-angled triangles. They solve equations of the form tan(8) =a, for a between 180 degrees and 360 degrees. They state the value of tan (8) in special cases.
Curated OER
Estimation of Population Growth By Counting Offspring: Seed Multiplication
Students calculate the reproductive rate of a plant that creates multi seed fruits. They graph exponential growth and the complete a series of questions that help them infer that natural selection processes are at work in this population.
Curated OER
Graphing the Elephant Seal Population Data
Students are able to graph data that they generated in the elephant seal exercise using proper format and labeling. They are able to interpret the graphs they created and make A) conclusions, and B) predictions based on that graph.
Curated OER
Count Down
Students are introduced to useing websites as a data source. Using bird population predictions, they test their predictions from various websites. They record, organize and graph the data and share their results with the class.
Curated OER
Daisyworld: Interactive On-line PC and Mac
Students use a JAVA interface to explore the Daisy World model to illustrate a mechanism through which - according to the Gaian hypothesis - biota might optimize their abiotic environment by means of negative feedback.
Curated OER
Eerie Indiana!
Eleventh graders research the population for ten cities in their state, in this example, Indiana, using census information. They design a spreadsheet using the data and create a bar graph with the data. They complete follow up questions.
Curated OER
Food for Thought
Third graders conduct a survey of their class' favorite foods voting on 3-4 favorites overall. They then go to the computer lab and examine how to produce a horizontal bar graph by graphing the favorite foods of the class.
Curated OER
Exploring Scale
Sixth graders discuss how the scale and type of graph can change how the data appears. With a partner, they identify all the information about the graph in a specific amount of time and record them in a journal. To end the lesson plan,...
Curated OER
"Graph It"
Students work in teams to conduct short surveys of their classmates. They show their results using at least two different types of graphs.
Students separate into teams and are asked that each team to choose something that they are...
Curated OER
Absolute Value And Symmetry
Students engage in a lesson that is concerned with the concepts of absolute value and symmetry. They define the meaning of absolute value and graph functions and study the corresponding line and its symmetry. The lesson includes calculus...
Curated OER
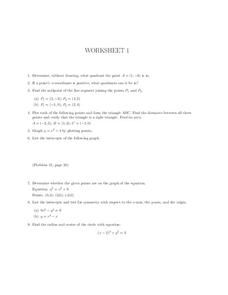
Worksheet 1, Coordinate Graphing
In this algebra worksheet, students determine the quadrant a given point is in. They find the midpoints of two line segments. Students plot points to form a triangle and find the distance between points. Students find the area of the...
Curated OER
Graph Functions: Practice
In this graph functions learning exercise, students complete several activities to help them graph functions. Students use the table and the graph to complete the questions. Students also answer two test prep questions.
Curated OER
Transformations in the Coordinate Plane: Reteach
In this transformations learning exercise, students review the terms and example diagrams for a translation, reflection, and rotation. Students then identify the coordinates for a triangle after completing the given transformations in...
Curated OER
Comparison of Images Formed by Plane, Cylindrical, and Spherical Mirrors
Students observe how reflections differ in various types of mirrors. In this reflection lesson, students use cylindrical mirrors, plane mirrors, and concave mirrors to observe how each reflects the student's face.
Curated OER
Domino Dash
Eighth graders examine the relationship between speed, time and distance. In this motion lesson students complete a lab activity that allows them to calculate average speed.
Curated OER
Identifying Points in the Coordinate Plane
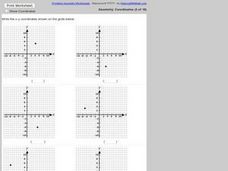
For this ordered pairs worksheet, students identify 6 ordered pairs given a coordinate plane. Students list the ordered pair given the graph.


