Curated OER
Basic Excel
Young scholars explore basic Excel spreadsheets. In this spreadsheet lesson plan, students enter Alaska weather information and perform calculations. Young scholars title the columns on the spreadsheet and format the cells. Students...
Curated OER
Student News And Weather Channel
Fabulous! Your 5th graders should love this project. As an ongoing lesson plan throughout the year students use temperature probes to record outside temperature and then document their data using spreadsheets. They use their weather data...
Curated OER
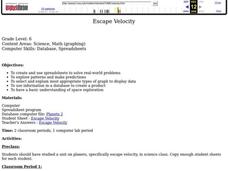
Escape Velocity
Sixth graders create/use spreadsheets to solve real-world problems, explore patterns, make predictions, select/explain most appropriate types of graph to display data, use information to create product, and have basic understanding of...
Curated OER
Basic Algebra and Computers: Spreadsheets, Charts, and Simple Line Graphs
Students, while in the computer lab, assess how to use Microsoft Excel as a "graphing calculator." They view visual representations of line graphs in a Cartesian plane while incorporating basic skills for using Excel productively.
Curated OER
Graphically Speaking
Students discover the links between population and Congressional representation. In this government lesson plan, students research population statistics and create spreadsheets that compare population to the number of Congress members...
Curated OER
Income Levels & Social Class: Is It All About Cash?
Students graph data and interpret that data after reading information about lifestyles and income levels. They calculate percentages, set up spreadsheets and calculate columnar data.
Curated OER
Let's Get Linear
Math whizzes utilize spreadsheets to examine linear modeling. They roll marbles down a ramp from three different heights and measure how far they roll. They use Excel to record their data and create a plot of their data.
Curated OER
Is That Your Final Answer?
This unit on integers includes a pre-test, a post-test, four spreadsheets, and links to an interactive web-site to support the learning of integer operations. Access to computers and the Internet are imperative to this unit. The lessons...
Curated OER
Level III: Technology Integration
Fourth graders prepare two spreadsheets each with an embedded line graph that displays data about the growth of the bitter rot fungus on apples and on petri dishes that were stored in the refrigerator and the classroom. They prepare a...
Curated OER
Dental Detectives
First graders explore the theme of dental health and hygeine. They make tooth loss predictions, count lost teeth, and graph tooth loss. In addition, they listen to dental health stories, read online stories, create spreadsheets, and play...
Code.org
Making Data Visualizations
Relax ... now visualize the data. Introduce pupils to creating charts from a single data set. Using chart tools included in spreadsheet programs class members create data visualizations that display data. The activity encourages...
Curated OER
Temperature High and Lows
Students gather high and low temperature readings through email. In this temperature graphing lesson, students use a spreadsheet to input data for a graph. students interpret the graphs to compare and contrast the data from different...
Curated OER
Dino-Myte Spreadsheet
Do your learners like dinosaurs and theme parks? An ambitious lesson invites learners to put together a plan for supplying dinosaurs for a new theme park. Pupils work together in groups to come up with their plan, which must include a...
Curated OER
Birds, Fractions and Percentages
Students study fractions, percentages, spreadsheets, and computers by watching and recording the number of species of birdsseen. They create a spreadsheet to record the results of their one month study.
Earth Watch Institute
Entering Local Groundhog Data in an Excel Spreadsheet
Here is a cross-curricular ecology and technology lesson; your learners create spreadsheets depicting the location and number of groundhog dens in a local park. They research groundhogs and analyze data about where the groundhog...
Curated OER
The Solstices
Compare surface temperatures when the solstice occurs in the different hemispheres. Young scientists draw conclusions from their investigation of data collected using spreadsheets and a globe.
Council for Economic Education
Loan Amortization - Mortgage
When you buy a home for $100,000, you pay $100,000—right? On the list of important things for individuals to understand, the lesson plan presents the concept of interest rates and loan amortization using spreadsheets and online sources....
Texas Education Agency (TEA)
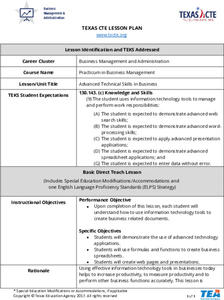
Advanced Technical Skills in Business
Scholars put their technical skills to the test as they practice writing a business letter, creating charts and spreadsheets, and designing a flyer. Additionally, pupils create a PowerPoint presentation about a professional topic of...
Curated OER
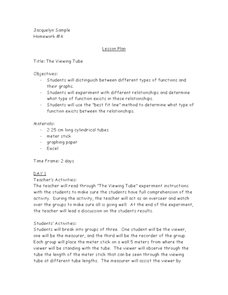
The Viewing Tube
Looking for an excellent lesson that incorporates math, science, and technology? Groups of three students use a viewing tube to perform an experiment, and discover how to organize their data into an Excel spreadsheet. This is a very...
Curated OER
What Color Are Your Skittles?
Students create spreadsheets and manipulate data. They collect data, create appropriate graphs and use percentages to describe quantities. Students compare and contrast data. They use spreadsheets to generate a pie chart.
Curated OER
Pollution Assessment: Is Wood Lake a Good Lake?
Young scholars become aware of pollution in Richfield Minnesota's Wood Lake, identify sources of pollution in Wood Lake, learn to use variables, equations, spreadsheets and modeling software, and generate solutions for the problem.
Curated OER
Baseball Statistics
Students read "Casey at the Bat" and then use individual player statistics (found through internet research)to determine if their players could be considered baseball "heroes". They must justify their choices for "hero" by creating...
Bowland
Speed Cameras
Do speed cameras help reduce accidents? Scholars investigate this question using a series of spreadsheet activities. Along the way, they learn about randomness, probability, and statistical analysis.
Curated OER
Fantasy Basketball
Students play Fantasy Basketball in order to practice locating Internet information and using technology tools to display data; students demonstrate an understanding and use of graphing, probability, and statistics.
Other popular searches
- Excel Spreadsheets
- Microsoft Excel Spreadsheets
- Meteorology and Spreadsheets
- Using Excel Spreadsheets
- Math Using Spreadsheets
- Heart Rate and Spreadsheets
- Creating Spreadsheets
- Math Spreadsheets
- Using Spreadsheets
- Spreadsheets Charts
- Excel Spreadsheets Graph
- Excel Spreadsheets Planets


