Curated and Reviewed by
Lesson Planet
This Graphs of Functions Based on Rules: Plotting Profits interactive also includes:
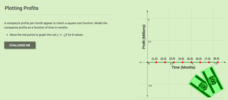
Profit from this interactive on graphing and interpreting functions. An interactive allows learners to plot a square root function representing a company's profits. They answer some challenge questions that require interpreting this profit function.
3 Views
1 Download
Concepts
Additional Tags
Instructional Ideas
- Use the last challenge question as a class discussion prompt
Classroom Considerations
- Free CK-12 account is necessary to access the resource
- Scholars should be able to graph functions given an equation
Pros
- Interactive is simple to use and directions are clear
- Tutorial includes review questions with answers in a separate document
Cons
- There is no indication as to why a square root function models profits
- Tutorial already shows how to graph the function in the interactive, so interactive is not instructive


