Big Kid Science
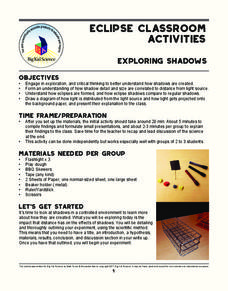
Exploring Shadows
What's that lurking in the shadows? An activity that demonstrates how eclipses happen. Science scholars investigate how light and distance interact to form shadows. The experiment uses simple materials to generate data and observations...
DiscoverE
Let's Make an Elastic Puppet
Create bending joints—but don't break! The activity shows how to make a puppet using straws and fishing line. Pupils create cuts to make joints that rely on the elasticity of the straw to bend and return to their original shapes.
Workforce Solutions
Social Media Pit Stop
Think before you post! Employers are watching! That's the takeaway from an activity that asks learners to rate their social media posts using a scale developed by recruiters. The activity ends with scholars brainstorming ways to improve...
Curated OER
Percentiles
Students analyze the bell curve and make predictions. For this statistics lesson, students calculate the percentile to the left of the curve. They then are given the percentile and create the graph from the data.
Curated OER
Z-Scores
Young scholars solve problems by identifying the percent of area under the curve. In this statistics lesson, students discuss z-scores as they calculate the different percentages under the bell curve. They calculate the standard deviation.
Curated OER
Statistics
High schoolers log their computer usage hours. They determine the mean, median, mode and standard deviation of the collected data. They make a frequency histogram of the grouped data, both on graph paper, and on the TI 83+ graphing...
Curated OER
What is a P-value?
Students test the hypotheses using p values. In this statistics lesson, students define and examine conditional probability. They test each statement for a true statement or a false statement, based on the sample size.
Curated OER
Bell Curve
Students explore averages by completing a data analysis activity. In this bell curve lesson, students measure different food items and plot their measurements on a X and Y axis. Students create bell curves around the average weight or...
Curated OER
Worksheet 15
In this math instructional activity, students sketch and label on a number line the regions that converge and diverge with the sequences. Then they examine a smooth function and define its series.
Curated OER
Effects of Temperature, Deviation on Climate
Students collect and record data for a given city. They calculate standard deviation of temperature and analyze the impact of climate changes on a city's and culture.
Curated OER
Numerical Analysis: Introduction to Approximation Theory
In this introduction to approximation theory, students compute the slope and intercept of a line. They describe nonlinear relationships. This four page activity contains approximately five problems.
Curated OER
Probability and Standard Deviation
In this probability and standard deviation worksheet, students answer 5 questions derived from one scenario that involving finding percentages.
Curated OER
Business & Statistics: Final Exam
In this business and statistics worksheet, young scholars read real-life business problems, arrange data, and identify the probability method best used to determine the answer. They identify the type of random sample, draw stem-and-leaf...
Curated OER
Business 90 Midterm 2: Probability
In this probability worksheet, students examine given business situations and determine the probability of an event. They create tree diagrams and contingency tables. This nine-page worksheet contains 7 multi-step problems.
Curated OER
Dating Sedimentary Strata
Students investigate how the age of sedimentary strata is determined. In this sedimentary strata activity, students work through problems that show that geological history covers millions of years. They distinguish between relative and...
Curated OER
Algebra 2/Trigonometry Regents Exam
Students review for the Regents Exam. In this math lesson plan, students review core concept for the Regents exam by working a variety of problems. A printable worksheet is provided.
Curated OER
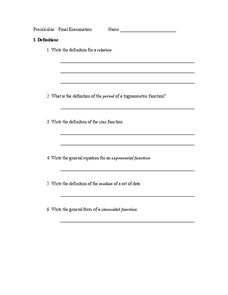
PreCalculus: Final Examination
In this final examination worksheet, students find the tangent function and sine function. They graph problems on a polar coordinate. Students describe trigonometric properties. This twelve-page worksheet contains 80 problems.
Curated OER
Meaning of Alpha
students define the alpha level. In this statistics activity, students identify what makes the "null rejected" and discuss the data surrounding the null. They observe the meaning of alpha as it relates to the bell curve.
Curated OER
Geometry Review
For this math review worksheet, students calculate the mean, median, mode, range, line segments, angles, and standard deviation for number and word problems. Students complete 11 problems.
Curated OER
Who is Being Left Behind?
Students investigate scores as they relate to race. In this algebra lesson, students analyze standardized scores and how race can affect these scores. They plot their findings on a graph and draw conclusions.
Curated OER
Technology in World War One
High schoolers research the types of technology and weapons used in World War I. They form groups representing countries and simulate an arms auction each bidding for the weapons of their choice. They compare their research to the...
Curated OER
Using Blood-Typing to Determine Causes of Death in Surgery Patients
In this simulation activity, young biologists examine blood types to determine whether the death rate in a hospital was caused because of incorrect identification of patient blood types. You will need obtain and follow the procedures of...
PBS
The Egg
The first stage in the butterfly's life cycle is the egg. Young entomologists discuss why different butterflies lay different eggs and what their eggs look like. Then they use the handouts to make a replica of one type of butterfly egg...
Illustrative Mathematics
Accuracy of Carbon 14 Dating I
Here is an activity that is intended to highlight a very important issue about precision in reporting and understanding statements in a realistic scientific context. Discuss different ways of reporting the half life of Carbon 14 using...
Other popular searches
- Normal Distribution Z Scores
- Standard Normal Distribution
- Normal Distribution Activity
- Normal Distribution Grade 10
- Z Score Normal Curve
- Standard Normal Curve
- Statistics Normal Curve
- The Normal Distribution
- Drawing Normal Curve
- The Normal Curve
- Normal Curve Correlation


