Curated OER
A is for Apple
Learners participate in a variety of activities to learn about apples. Students graph apples, learn about apple uses, taste apples, and observe what happens when apples are dipped in lemon juice.
Curated OER
Taste Test
Third graders practice creating bar graphs by conducting a taste test. In this graphing lesson, 3rd graders taste several different brands of peanut butter and discuss among their classmates which tastes better. Students create a bar...
Curated OER
Frequency Words
First graders use a graph to answer questions about the frequency of words. Using rhymes, they fill in a chart about the data they collected. In groups, they use their word wall words to identify them in a book.
Curated OER
Apple Eaters
Students sample a variety of apples and graph group results for the class favorites. They orally explain the graph.
Curated OER
Which is Your Favorite Beatrix Potter Book?
In this survey worksheet, students use the form to gather information on people's favorite Beatrix Potter books. Students graph the results. Prior knowledge of multiple Beatrix Potter books is assumed.
Curated OER
Which is Your Favorite Dr. Seuss Book?
In this student survey worksheet, students gather information on classmates' favorite Dr. Seuss books. Students use a second worksheet to graph the results of their surveys.
Curated OER
Enhancing Writing Through Technology
Students participate in a class survey of their favorite activity to do in the snow and organize the results in a graph. They write a paragraph about the graph using language from a class-developed word web and include both an opening...
Curated OER
Little Auk Survival Challenge
A bird's life is one of danger and intrigue as it struggles for survival in sometimes harsh environments. To understand how difficult surviving in the wild can be, children play a simulation game where they act as little auks, birds from...
Curated OER
Recording Data From a Survey Reteaching Worksheet
In this recording data from a surveys reteaching worksheet, 2nd graders review the use of tallies when recording data. They use the information to make a data table and a bar graph that displays the information.
Curated OER
Capture the Penguin
In this graphing instructional activity, students play a game called Capture the Penguin where they put their penguins onto a graph with another player, roll dice to form ordered pairs, and start eliminating penguins. Students look at...
Curated OER
First Grade Shoe Sizes
Third graders collect shoe size data from classmates in their room and another third grade. They predict what the most common shoe size will be. They place the data in an spreadsheet on the computer. They design a graph using the...
Curated OER
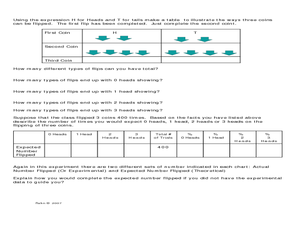
Excel Lesson Plan Coin Statistics
Second graders determine the difference between making a prediction and determining actual information. They design a spreadsheet for a coin flipping activity on which they include their predictions and what actual happens when they flip...
Curated OER
Boats Graph
Pupils read from the Bible about the travels of Paul, particularly the boat rides. They trace Paul's travels on a map of Asia Minor. Students review a field trip they took and make a graph showing the numbers of each type of boat they...
Curated OER
Recording Frequency
First graders analyze nursery rhymes and gather data about word frequency. In this frequency lesson, 1st graders create graphs and tables. Students interpret the data.
Curated OER
Pancakes, Anyone?
First graders explore data collecting and graphing. In this data collecting and graping lesson, 1st graders watch a video about monster who sells pancakes. Students make a graph to record the most popular pancake. Students also play...
Curated OER
Easter Egg Pictograph
In this pictograph instructional activity, learners use a given graph to answer questions about Easter eggs found by children and answer related questions. A website reference for additional resources is given.
Curated OER
Virtual Field Trip
Are we there yet? Young trip planners learn about their state and plan a trip. They will select sites to see in three cities in their state, and record associated costs in a spreadsheet. While this was originally designed as a...
Curated OER
Presentation of Quantitative Data- Vertical Line Diagrams
In this quantitative data worksheet, students examine how vertical line diagrams can be used to display discrete quantitative data. They read about the use of tally charts to create vertical line graphs that display the data. They...
Curated OER
Pumpkin Seed Experiment
In this unique lesson students participate in a pumpkin seed experiment. Students interact with the pumpkins weight, seeds and record their findings of what lies within the pumpkin once the top of the pumpkin is cut off for observations....
Curated OER
Probability With a Random Drawing
Students define probability, and predict, record, and discuss outcomes from a random drawing, then identify most likely and least likely outcomes. They conduct a random drawing, record the data on a data chart, analyze the data, and...
Curated OER
Let's Flip a Coin
In this probability worksheet, students use a TI graphing calculator to simulate flipping a coin and compare their results (experimental probability) to the expected results (theoretical probability). The five page worksheet contains...
Utah LessonPlans
Seed Sort
Students form a variety of categories for seed mixes (wild bird seed or 15 bean soup) and create graphs to display their categories.
Curated OER
Jelly Belly: What a Wonderful "Bean"!
Students explore how jelly beans are produced. They discuss the origins of the jelly bean and view a video about how jelly beans are prepared, tested, shaped, finished, and shipped and estimate the amount of jelly beans in a jar and sort...
Curated OER
The Two Coin Problem
In this math worksheet, students look for the answers to the 17 applications of looking at the outcomes of flipping two coins. They also graph the results.


