Fort Bend Independent School District
Data Analysis - AP Statistics
What better way to study survey design than to design your own survey! Bring a versatile data analysis project to your AP Statistics class, and encourage them to apply the practices from their instructions to a real-world survey...
Curated OER
Data Collection and Presentation
Middle and high schoolers collect and analyze data from four different activities. The activities include information about classmates, tallying colors of cars in a parking lot, stem and leaf plots, and making a histogram from...
Math Moves U
Collecting and Working with Data
Add to your collection of math resources with this extensive series of data analysis worksheets. Whether your teaching how to use frequency tables and tally charts to collect and organize data, or introducing young...
American Museum of Natural History
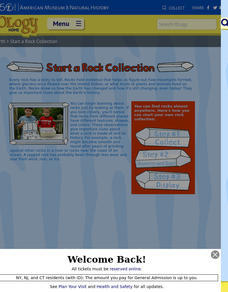
Start a Rock Collection
Rocks hold evidence of Earth's past. A three-step guide describes the process of creating a rock collection. It provides a data collection sheet to make notes about each sample.
Curated OER
Eastern European Studies
One worksheet, three projects. Learners explore Eastern Europe and mark Eastern European countries on a map. They then collect and record census data on thirteen different countries, and write a 3-5 page expository essay on one of the...
Curated OER
Collecting Data
In this data collection worksheet, students read about how data is collected and organized. They also learn about a hypothesis. Students read through examples of different charts and then answer 23 questions pertaining to data...
Curated OER
Thinking Science - Collecting Data
In this data collection instructional activity, students write the data that can be collected about bluebirds and nests and the tools they would use to collect this data. Students complete 14 rows of data.
Scholastic
Study Jams! Scientific Theory & Evidence
Introduce someday scientists to ideas and explanations about how the world around us works by showing this cute cartoon. In it, Mia and Sam discuss what scientific theory is, and how it is important in discovering scientific laws making...
Houston Area Calculus Teachers
Collecting Driving Data
Give AP Calculus classes the opportunity to check the accuracy of their calculations! A calculus activity involves the collection of data, the application of mathematics, and the analysis of the accuracy of results. Young mathematicians...
EngageNY
Summarizing Bivariate Categorical Data in a Two-Way Table
Be sure to look both ways when making a two-way table. In the lesson, scholars learn to create two-way tables to display bivariate data. They calculate relative frequencies to answer questions of interest in the 14th part of the series.
Curated OER
Frequency Tables; Discrete Ungrouped Data
In this frequency tables worksheet, students utilize given data to work out three frequency charts with one containing values and a pie chart involving angles for each value. Students complete three vertical line diagrams and check all...
Curated OER
Graphs that Represent Data Sets
These four scenarios all contain graphable data; can scholars match them to the correct bar graphs? All the data is in single-digit whole numbers. Some of the scenarios instruct kids to make a graph, while others don't. Clarify...
Curated OER
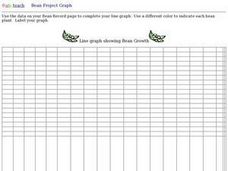
Bean Growth Project Graph Worksheet
In this bean growth project graphing activity, student collect data and create a line graph. They use a different color for each line that shows the growth of each bean plant.
California Education Partners
Science Fair Project
Plant the data firmly on the graph. Given information about the growth rate of plants, pupils determine the heights at specific times and graph the data. Using the information, scholars determine whether a statement is true and support...
Cornell Lab of Ornithology
Investigating Evidence
Explore the scientific process through nature. Scholars become scientists as they develop a question, design an experiment, collect data, and analyze their results. A two-week lesson guides your classes through the process and provides...
PBL Pathways
Medical Insurance 2
Make an informed decision when choosing a medical insurance provider. An engaging lesson asks your classes to write piecewise models to represent the cost of different medical plans. The project-based learning activity is a variation of...
Houston Area Calculus Teachers
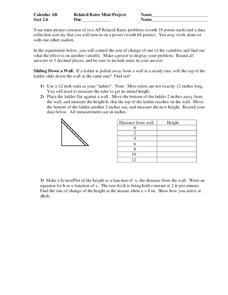
Related Rates
Use a hands-on approach to exploring the concepts of related rates in your AP Calculus class. Individuals explore the effect of the rate of change on a variable related to a variable they control. After analyzing the data they...
Curated OER
Exploring Online Data Analysis Tools Project Interactivate- Plop It
In this data analysis worksheet, students access an online data analysis tool at the given web site. They collect name length data for classmates and enter it into the tool. The find and manipulate the data to determine how the median is...
Intel
What Does This Graph Tell You?
What can math say about natural phenomena? The fifth STEM lesson in this project-based learning series asks collaborative groups to choose a phenomenon of interest and design an experiment to simulate the phenomenon. After collecting...
Curated OER
Quantitative Data
In this quantitative data worksheet, pupils compute measures of central tendency, draw vertical line diagrams, and compare collected data. This 23-page worksheet contains approximately 100 multi-step problems. Explanations and examples...
Concord Consortium
Heights and Weights
Height is dependent on weight—or is it the other way around? Given data from a physicians handbook, individuals compare the height and weight of males and females at different areas. They calculate differences and ratios to assist with...
Radford University
A Change in the Weather
Explore the power of mathematics through this two-week statistics unit. Pupils learn about several climate-related issues and complete surveys that communicate their perceptions. They graph both univariate and bivariate data and use...
PBL Pathways
Medical Insurance 3
Create a technical report explaining the components of a medical plan through a function. The project-based learning activity gives a medical insurance scenario that young mathematicians model using piecewise functions. Their analyses...
PBL Pathways
Medical Insurance
Design a plan for finding the best health insurance for your money. Learners compare two health plans by writing and graphing piecewise functions representing the plan rules. Using Excel software, they create a technical report...


