Curated OER
Determining the Point of Intersection Using the TI-83 Plus Calculator
Middle and high schoolers graph two lines and identify the point of intersection of each set of line. They use the TI calculator to help them graph and solve. There are six questions with detailed instruction on how to graph correctly.
Curated OER
The Coordinate Plane
Use this Saxon math coordinate plane instructional activity to have your learners utilize a graphing calculator, equate the vertices of a rectangle, and then graph their conclusions as well as answer a variety of fill in the blank...
Curated OER
Number Line: Negative Numbers
In this graphing calculator worksheet for the TI-83 calculator, middle schoolers first observe a demonstration for calculating negative numbers. Next, students use their graphing calculator to answer 6 thoughtful T/F and short answer...
Curated OER
Graphing Calculator Activity
In this graphing calculator learning exercise, students explore the steps to analyze a complex fraction using a graphing calculator. They simplify a complex fraction to a proper fraction. This four page learning exercise contains...
Curated OER
Linear Regression on TI-83
In this linear regression instructional activity, students use TI-83 calculators to graph linear regressions. Instructions for using the calculator are provided. This two-page instructional activity contains six problems.
Pingry School
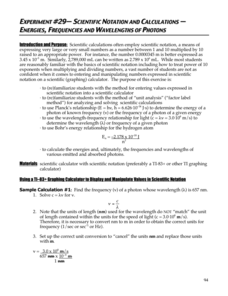
Scientific Notation and Calculations – Energies, Frequencies, and Wavelengths of Photons
The calculator has an interesting way of displaying numbers in scientific notation, but don't let that confuse your pupils! A lesson designed to give learners practice with scientific notation and calculators provides several practice...
Curated OER
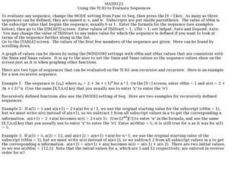
Using the TI-83 to Evaluate Sequences
In this evaluating sequences worksheet, students use the TI-83 graphing calculator to evaluate sequences. Instructions on how to use the calculator with these type of problems is provided. There are three problems on this one-page...
Curated OER
Negative Numbers on the Number Line Using the TI-83
In this negative numbers worksheet, students use the TI-83 calculator to compare the value of negative numbers. Students explain in short answer format how they used the calculator to determine their answers.
Curated OER
Finding the Extrema Graphically and Symbolically
In this extrema worksheet, students use the first derivative test and the second derivative test to determine the local extrema. They identify the local maximum and global maximum. This eight-page worksheet contains detailed...
Curated OER
Worksheet #2.6: MT-A141 PreCalculus
In this graphing worksheet, students predict how a graph of given functions will work. Next, they check their work using a graphing calculator. Students use algebra to complete the graph of a square and determine transformations.
Curated OER
Worksheet 2.4/2.5: MT-A141 PreCalculus
In this precalculus instructional activity, students use their graphing calculator to graph the domain and range of given terms. They write parametric equations and identify the coordinates of the points on the relation given certain...
Curated OER
Function Investigation
In this functions worksheet, 11th graders solve and complete 18 different problems. First, they graph each equation on the graphs provided, making a rough sketch on a coordinate plane. Then, students predict what each graph will look...
Curated OER
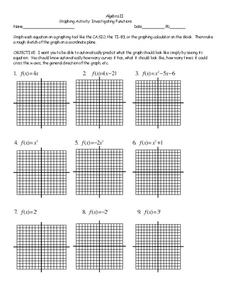
Investigating Functions
In this investigating functions worksheet, 11th graders solve and complete 18 different problems. First, they graph each equation on the graphs shown. Then, students make a rough sketch of graph on a coordinate plane. They also determine...
Curated OER
The Babylonian Algorithm, Limits and Rates of Change
In this successive approximations worksheet, students use the Babylonian algorithm to determine the roots of given numbers. They identify the limits of a function, and compute the rate of change in a linear function. This two-page...
Other
Ostermiller.org: Between Curves Tools
This site provides instructions for programs you can put into a graphing calculator to find the area between curves.
Oswego City School District
Regents Exam Prep Center: Regression Analysis
A collection of lesson ideas, a practice activity, and teacher resources for exploring regression analysis.


