Curated OER
Points on a Graph
In this points on a graph worksheet, students are given the coordinates and they have to plot the points and connect the dots. Students plot 8 points on the graph.
Curated OER
Graphing Ordered Pairs
Are you working on graphing ordered pairs in your class? For this worksheet, learners, after looking over and studying how to graph ordered pairs, plot points on a coordinate grid and connect the dots. Class members also identify what...
Curated OER
Plotting Coordinates on a Grid
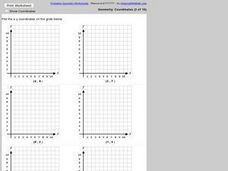
In this plotting points on a graph worksheet, students plot 6 points on 6 graphs. Students plot x and y-coordinates in the first quadrant.
Curated OER
Plot Points in the Coordinate Plane
In this basic worksheet on plotting coordinate points, student practice how to describe where an ordered pair is located on a graph.This activity can provide a short review of material covered in class.
Curated OER
Halloween Point Plot
Practice graphing and plotting points with a festive Halloween flair! Scholars plot 21 points on a grid, connecting them to create a spooky shape!
Curated OER
Plotting Points
In this coordinate pairs worksheet, students learn to plot points on a graph. Students study the examples and then complete 20 questions. This is intended as an online activity, but may be completed with pencil and paper.
Curated OER
Twenty-Seven Graphing Lines, Parabolas, and Absolute Value Problems
Have learners find coordinates of point on a graph, find equations of graphs given, and graph given equations using in and out tables. There are 27 problems related to equations for lines, parabolas, and absolute value functions.
Math Drills
Halloween Cartesian Art: Witch Hat
What is the mystery picture? After plotting points on the first quadrant of a Cartesian coordinate system, young mathematicians connect the points to create a Halloween-themed picture.
Curated OER
Coordinates
For beginning point plotters, these graphs give a good introduction. They examine a graph with shapes drawn onto it and each vertex labeled. There are 20 total, and scholars write the coordinates of each labeled point. All of these are...
Kuta Software
Points in the Coordinate Plane
Keep young mathematicians on point with this coordinate plane worksheet. From plotting ordered pairs to identifying the quadrant and coordinates of specific points, this resource covers all the basic skills students need to have...
CK-12 Foundation
Line Graphs to Display Data Over Time: Strawberry Competition
Take the tediousness out of graphing. Using the interactive tool, learners can efficiently create a line graph from a set of data. They then use the graph to answer questions about specific trends in the data.
Curated OER
Number Pairs
This engaging coordinate pairs activity will have scholars intrigued; they mark 13 points on a grid and then connect them to create a capital block letter. Which one will it be? The grid has whole numbers 0-10 along both axes, so...
Curated OER
Exercises in Plotting Points
In this geometry activity, learners practice plotting points on coordinate grids. They plot and translate points in 6 grids.
Curated OER
Points in Three Dimensions
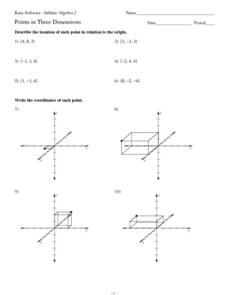
In this plotting points instructional activity, students plot 18 points in the 3-D plane. Students plot points on a graph given a point.
Willow Tree
Graphing
So many methods and so little time! The efficient method of graphing a linear equation depends on what information the problem gives. Pupils learn three different methods of graphing linear equations. They graph equations using...
Curated OER
Location on a Grid
Locating a point on a grid is an important skill to master; use this practice sheet to give schlars some clear and useful experience. On a large, simple grid they use a coordinate system to find specific squares and color them a given...
Scholastic
Study Jams! Choosing the Correct Graph
With so many types of graphs, don't let your learners get stuck figuring out which one to use. To track how Zoe spent her allowance, use this interactive lesson to review all the types of graphs and pick the best one to display the data....
Curated OER
Graphing
In this graphing worksheet, students solve and graph 10 different problems that include determining various coordinates and the slope. First, they use the table to write the x and y coordinates for each point on the graphs. Then,...
Charleston School District
Graphing Functions
How do letters and numbers create a picture? Scholars learn to create input/output tables to graph functions. They graph both linear and nonlinear functions by creating tables and plotting points.
CK-12 Foundation
Graphs in the Coordinate Plane: Functions on a Cartesian Plane
Connect the dots to graph a linear function. Young mathematicians use an interactive to first plot provided points on a coordinate plane. They connect these points with a line and then answer questions about the slope and y-intercept of...
CK-12 Foundation
Function Rules based on Graphs: Making Money in the Hat Business
Hats off to those learning about the graphs of functions. Individuals use an interactive to plot points representing profits for a hat business. They identify a quadratic equation to represent this function and answer challenge questions...
Curated OER
Plotting Points
In this plotting points worksheet, students are given eight points to plot on a coordinate plane. Afterward, they plot eight additional points and then translate the points according to given instructions. This one-page worksheet...
Curated OER
The Effect of Dissolved Salt on the Boiling Point of Water
Explore the properties of solutions with a lab activity. Chemistry fans determine the boiling point of water, add salt to create a solution, and then repeat the process four more times. They design their own data table and then graph the...
EngageNY
Drawing the Coordinate Plane and Points on the Plane
To plot a point in the coordinate plane, you first need a coordinate plane. Pupils learn to draw an appropriate set of axes with labels on a coordinate plane. They must also determine a reasonable scale to plot given coordinate pairs on...


