Better Lesson
Better Lesson: Box and Whiskers Activity
The students will be working in stations to construct and analyze box plots. All activities are of high interest and rich in content.
Better Lesson
Better Lesson: Box and Whiskers... Analyzing and Creating
The students will be using discovery techniques to learn about box and whisker plots.
Khan Academy
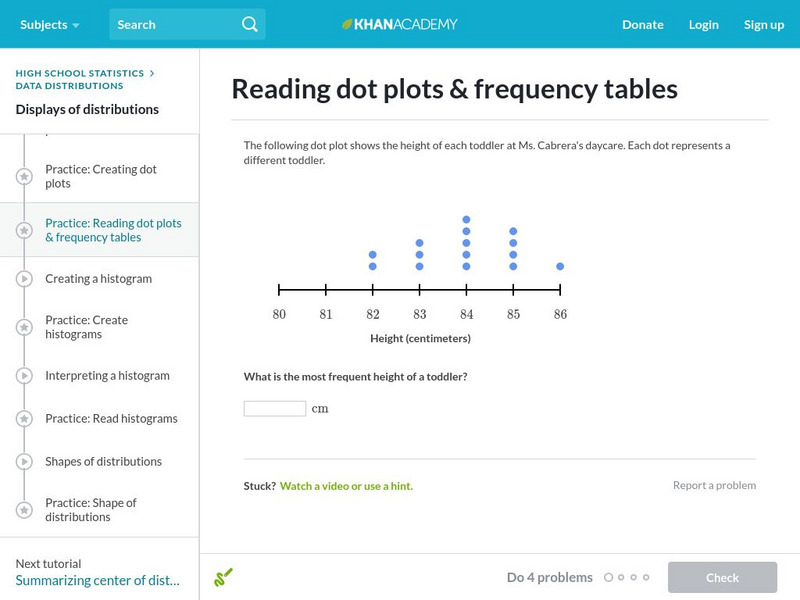
Khan Academy: Reading Dot Plots and Frequency Tables
In this exercise, students practice reading dot plots and frequency tables. Students receive immediate feedback and have the opportunity to get hints and try questions repeatedly.
ReadWriteThink
Read Write Think: Using Picture Books to Teach Plot Development and Confict Res.
Students read picture books to explore the concepts of plot development and conflict resolution. They first learn about the connections between reading and writing, and then revise their own writing. CCSS.ELA-Literacy.CCRA.R.4
Texas Instruments
Texas Instruments: Measure Up
In this activity, students compare their height with the average height of students in the class. They create histograms to analyze the data, and construct box plots to summarize the height statistics.
CK-12 Foundation
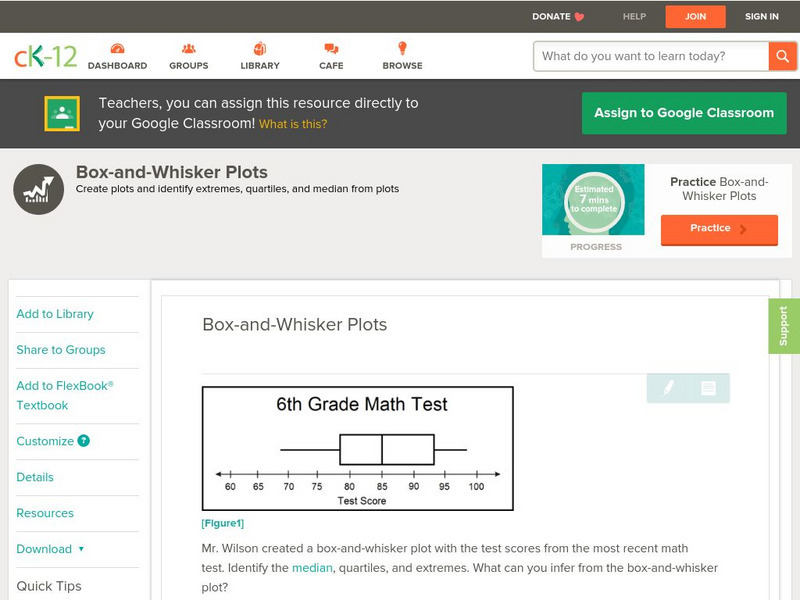
Ck 12: Statistics: Box and Whisker Plots Grade 6
[Free Registration/Login may be required to access all resource tools.] Draw and analyze a box-and-whisker plot.
Texas Instruments
Texas Instruments: Let's Play Ball With Box and Whisker Plots
This activity is designed to help students make decisions about what and how information could be displayed graphically. The data set deals with salaries of professional baseball players. It is designed for students to determine if the...
Texas Instruments
Texas Instruments: How Far to Your Birthplace
Examine one-variable data analysis through the creation and exploration of a birth place data set. Graphing calculators are used to analyze the data through mean, median, mode, maximum, minimum, stem-and-leaf plots and box-and-whisker...
Texas Instruments
Texas Instruments: Math Today for Ti Navigator System Super Ticket Sales
Students will create two box-and-whisker plots of the data in the USA TODAY Snapshot, "Super ticket sales". Students will calculate central tendencies for both sets of data. Students will compare the two sets of data by analyzing the...
Texas Instruments
Texas Instruments: Math Today Super Ticket Sales
Students will create two box and whisker plots of the data in the USA TODAY Snapshot. They will calculate central tendencies for both sets of data and compare the two sets of data by analyzing the differences in the box and whisker plots.
Oswego City School District
Regents Exam Prep Center: Practice With Organizing and Interpreting Data
Several problems are presented to test your skills in creating and interpreting frequency tables, pie charts, box-and-whisker and stem-and-leaf plots.
Texas Instruments
Texas Instruments: Numb3 Rs: Stylometry
Based off of the hit television show NUMB3RS, this lesson has students analyze two samples of writing to determine who is the author of a third piece of writing. While the actual statistics would be overwhelming for students, this lesson...
Texas Instruments
Texas Instruments: Survey Project
Students survey other students (numerical and non numerical data) and calculate measures of central tendency (if possible) of data and make regular box-an-whisker plots and outlier box-and-whisker plots to analyze the data.

