NOAA
Noaa: Ngdc: Images, Visualizing Data
The National Geophysical Data Center has transformed extensive ocean research into colorful video, 3D maps, charts posters and more! This site starts off with a film clip of a dive into the Marianas trench and then lead you to other...
Vision Learning
Visionlearning: Data: Using Graphs and Visual Data in Science
An explanation of how data can be turned into visual forms which can help people comprehend information easier than observing numbers.
NASA
Nasa: Visible Earth: 3 D Data From Ice Sat
3-D Data from ICESat: Orbiting the Earth at nearly 17,000 miles per hour, NASA's Ice, Cloud and land Elevation Satellite (ICESat) is collecting spectacular new three-dimensional measurements of the Earth's surface and atmosphere.
Science Education Resource Center at Carleton College
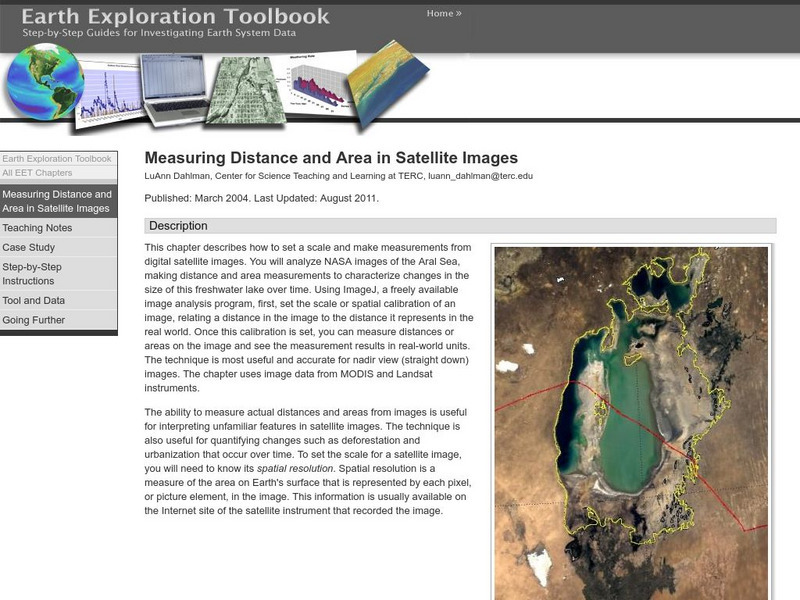
Serc: Measuring Distance and Area in Satellite Images
Young scholars will select from a series of Satellite images of the Aral Sea from 1973 through 2003 and will measure changes in the area of the lake and distance across the lake over time.
Science Education Resource Center at Carleton College
Serc: Exploring and Animating Goes Images
Students learn how to transform a series of GOES images into an animation, and how to create a storm track from that animation. By synthesizing information from the track and other sources, students determine storm speed and direction.
NOAA
Noaa: Volcano Data at National Geophysical Data Center
National data bases provide information on significant volcanic eruptions, volcano location, volcano images, volcanic ash advisory, and satellite monitoring of volcanoes.
NASA
The Solar Data Analysis Center (Sdac)
The Solar Data Analysis Center at NASA provides all the latest information learned about the sun. Content includes a look at information brought back by several satellites.
National Snow and Ice Data Center
National Snow and Ice Data Center: All About Glaciers
Extensive information about glaciers. Tells about the life of a glacier, how they form, how they impact the surrounding areas, and what happens when glaciers stop growing. Includes a photo gallery, and links to scientific research on...
Other
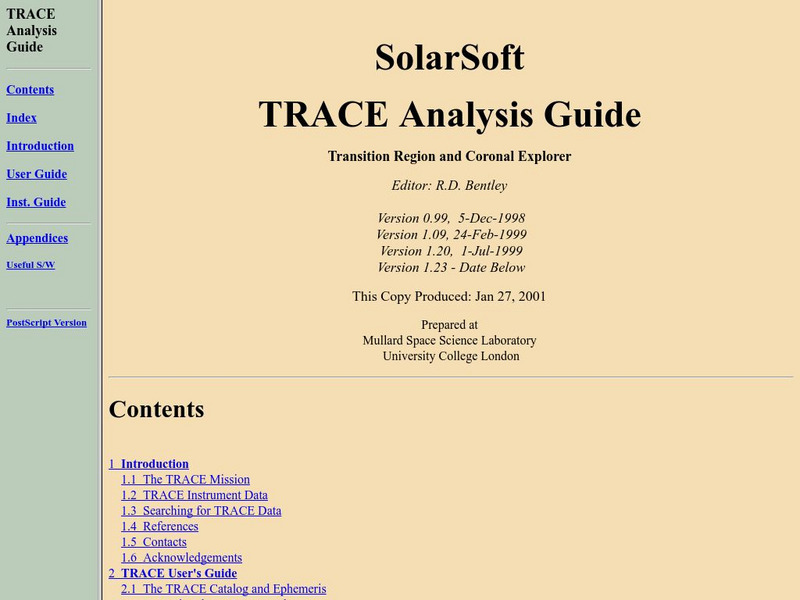
Solar and Astrophysics Lab: Trace Analysis Guide
This site provides a detailed overview of the TRACE (Transition Region and Coronal Explorer) satellite mission, data received, details about the instrumentation, and how to interpret the data.
NASA
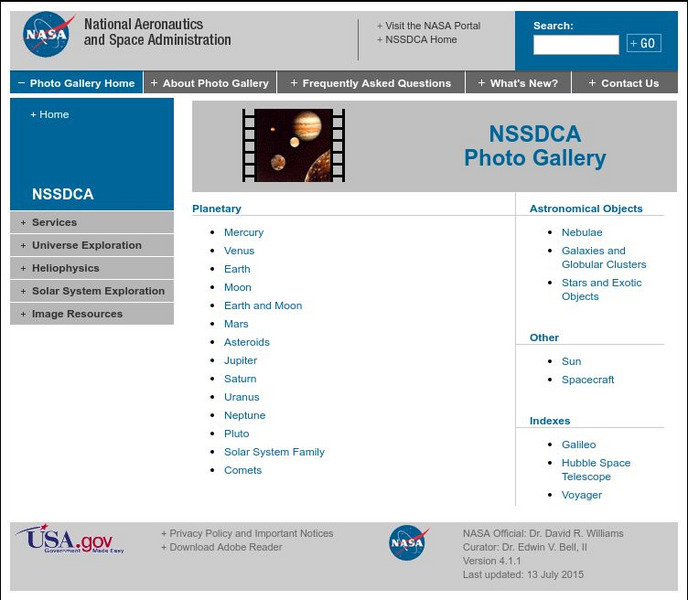
Nasa Space Science Data Archive: Photo Gallery
A website featuring a collection of images from NASA. Collection includes images of planets, comets, nebulae, galaxies, stars, sun, and spacecrafts.
Library of Congress
Loc: Photo Analysis Presenting the Statue of Liberty
The ability to examine a primary source is a gateway to building critical thinking skills and constructing knowledge. This lesson provides the students an opportunity to observe similarities and differences between 2 visual images,...
NASA
Nasa Space Science Data Archive: Photo Gallery: Venus
Photos of Venus' surface and cloud tops. Includes 3-D surface views. Thumbnail images load quickly and link to larger files for more detail.
TED Talks
Ted: Ted Ed: How to Find the True Face of Leonardo
Mona Lisa is one of the best-known faces on the planet. But would you recognize an image of Leonardo da Vinci? Illustrator Siegfried Woldhek uses some thoughtful image-analysis techniques to find what he believes is the true face of...
NASA
Nasa Space Science Data Archive: The Mariner Missions
This web page contains detailed information on the Mariner 4 spacecraft. The page explains that the Mariner 4 was the first spacecraft to obtain information at close range on Mars. This page also contains information about other Mariner...
Khan Academy
Khan Academy: Analysis of Image Production by the Human Eye
Analysis of Image Production by the Human Eye.
University of Canterbury
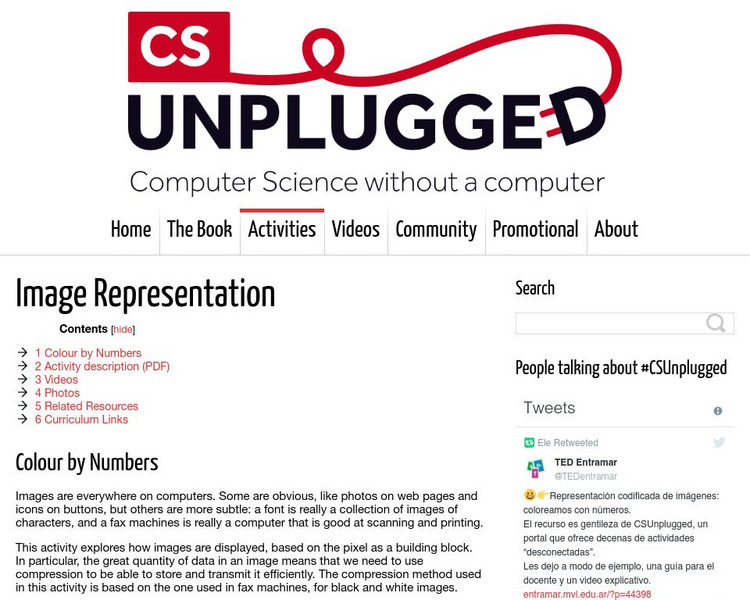
University of Canterbury: Cs Unplugged: Image Representation
This activity explores how images are displayed, based on the pixel as a building block using data compression. The compression method used in this activity is based on the one used in fax machines, for black and white images.
Other
Data Driven Decision Making: A Powerful Tool for School Improvement [Pdf]
This resource will provide a basic framework for analyzing today's data-driven decision-making options and outline information about the basic elements and steps involved in implementing a data-driven decision-making system to facilitate...
US National Archives
Nara: Teaching With Documents: Images of the American Revolution
The National Archives and Records Administration provides a lesson plan on the American Revolution. Content includes excellent historical background, as well as several primary source documents, pictures, and engravings detailing various...
Science Education Resource Center at Carleton College
Serc: Using Satellite Images to Understand Earth's Atmosphere
This lesson helps students select, explore, and analyze satellite imagery. Students investigate the relationship between atmospheric carbon monoxide and aerosols. Incorporate ImageJ to animate a year of monthly images of aerosol data and...
Other
Digital Visual Analysis
When we engage in digital visual analysis, we can come to understand how the various elements within a digital visual image work together to create a persuasive message. Learn how to analyze an image to get as much information as you can...
Library of Congress
Loc: Introducing Students to Visual Analysis
Students will develop visual literacy skills by analyzing the images from John White Alexander's mural in the Thomas Jefferson building of the Library of Congress while learning about the history of the Library of Congress. Then,...
NASA
Nasa Space Science Data Archive: Neptunian Rings Fact Sheet
A data table of nearly everything known about the ring system of Neptune. The resource also includes an image of the rings of Neptune that can be enlarged.
Science Education Resource Center at Carleton College
Serc: Creating Custom Map Images of Earth and Other Worlds
Become familiar with Jules Verne Voyager, a freely-available online map tool that includes data for Earth as well as several other planets and moons. Create a variety of map images and then save and import the images into a presentation...
NASA
Nasa Space Science Data Archive: Mercury From Mariner 10, Degas Crater
Single image mosaic from NSSCD Mariner 10 collection. Shows detail of an impact basin with typical ray structures. Thumbnail image links to large graphic file with more detail.







![Data Driven Decision Making: A Powerful Tool for School Improvement [Pdf] Handout Data Driven Decision Making: A Powerful Tool for School Improvement [Pdf] Handout](http://content.lessonplanet.com/resources/thumbnails/410106/large/bwluav9tywdpy2symdiwmduymc0ymji2os1jy3v1azeuanbn.jpg?1589985462)
