Hi, what do you want to do?
E-learning for Kids
E Learning for Kids: Math: Russian Toy Store: Data and Graphs
Students will play a learning game to interpret data on graphs.
Vision Learning
Visionlearning: Data: Using Graphs and Visual Data in Science
An explanation of how data can be turned into visual forms which can help people comprehend information easier than observing numbers.
E-learning for Kids
E Learning for Kids: Math: Elephant Plant: Data and Graphs
On this interactive website students practice various math skills using a real-life scenario involving plants. Those skills include interpreting data in a circle graph, interpreting data in a divided bar graph, and interpreting a bar...
Scholastic
Scholastic: Cultivating Data
Students will understand key concepts of data analysis and their graphic representations. Students will construct and interpret data tables, line plots, box-and-whisker plots and stem-and-leaf plots, scatterplots with line of best fit,...
National Center for Ecological Analysis and Synthesis, University of California Santa Barbara
Kids Do Ecology: Data and Science
Learn about conducting your own investigation with these tips on following the scientific method. Find out how to state hypothesis, make observations, collect and analyze data, and display data to share results and conclusions of your...
E-learning for Kids
E Learning for Kids: Math: Tea Store: Data and Graphs
Play games by exploring how to interpret bar graphs and organize data in a table.
PBS
Pbs Kids Afterschool Adventure!: Operation: Data Saves the Day Activity Plan
Data comes to the rescue! Children will collect, analyze, and represent data as they try to dodge a series of catastrophes faced by characters from their favorite PBS Kids shows.
NASA
Nasa: Using Radiosonde Data From a Weather Balloon Launch
This lesson plan allows learners to learn about the layers of the atmosphere and to learn how to graph real atmospheric data.
Next Gen Personal Finance
Next Gen Personal Finance: Managing Credit Data Crunch
Data Crunches feature one chart or graph followed by five scaffolded questions to guide students through analyzing the data and drawing conclusions. These sets of data help students understand financial concepts.
Next Gen Personal Finance
Next Gen Personal Finance: Saving Data Crunch
Data Crunches feature one chart or graph followed by five scaffolded questions to guide students through analyzing the data and drawing conclusions. These sets of data help students understand financial concepts.
Next Gen Personal Finance
Next Gen Personal Finance: Checking Data Crunch
Data Crunches feature one chart or graph followed by five scaffolded questions to guide students through analyzing the data and drawing conclusions. These sets of data help students understand financial concepts.
Next Gen Personal Finance
Next Gen Personal Finance: Career Data Crunch
Data Crunches feature one chart or graph followed by five scaffolded questions to guide students through analyzing the data and drawing conclusions. These sets of data help students understand career concepts.
Next Gen Personal Finance
Next Gen Personal Finance: Investing Data Crunch
Data Crunches feature one chart or graph followed by five scaffolded questions to guide students through analyzing the data and drawing conclusions. These sets of data help students understand investment concepts.
Next Gen Personal Finance
Next Gen Personal Finance: Types of Credit Data Crunch
Data Crunches feature one chart or graph followed by five scaffolded questions to guide students through analyzing the data and drawing conclusions. These sets of data help students understand credit concepts.
Next Gen Personal Finance
Next Gen Personal Finance: Insurance Data Crunch
Data Crunches feature one chart or graph followed by five scaffolded questions to guide students through analyzing the data and drawing conclusions. These sets of data help students understand insurance concepts.
Next Gen Personal Finance
Next Gen Personal Finance: Taxes Data Crunch
Data Crunches feature one chart or graph followed by five scaffolded questions to guide students through analyzing the data and drawing conclusions. These sets of data help students understand tax concepts.
Next Gen Personal Finance
Next Gen Personal Finance: Financial Pitfalls Data Crunch
Data Crunches feature one chart or graph followed by five scaffolded questions to guide students through analyzing the data and drawing conclusions. These sets of data help students understand financial concepts.
Next Gen Personal Finance
Next Gen Personal Finance: Budgeting Data Crunch
Data Crunches feature one chart or graph followed by five scaffolded questions to guide students through analyzing the data and drawing conclusions. These sets of data help students understand financial concepts such as budgeting.
Next Gen Personal Finance
Next Gen Personal Finance: Paying for College Data Crunch
Data Crunches feature one chart or graph followed by five scaffolded questions to guide students through analyzing the data and drawing conclusions. These pertain to paying for college.
University Corporation for Atmospheric Research
Ucar: Weather and Climate Data Exploration
Young scholars explore the relationship between weather and climate by graphing weather temperature data and comparing with climate averages.
Shodor Education Foundation
Shodor Interactivate: Comparison of Univariate and Bivariate Data
Young scholars learn about the difference between univariate and bivariate data and understand how to choose the best graph to display the data.
Center for Innovation in Engineering and Science Education, Stevens Institute of Technology
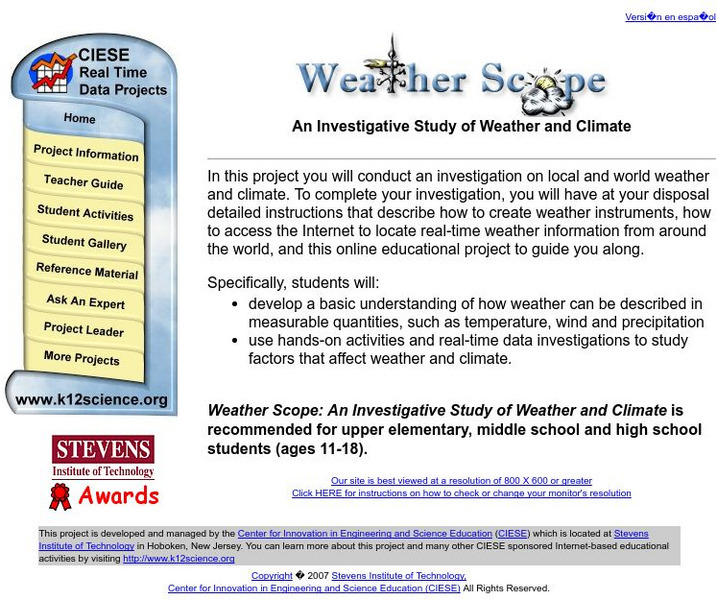
Ciese Real Time Data Projects: Weather Scope: A Study of Weather and Climate
Use real-time data to study factors that affect weather and climate, create weather instruments, and share data with students around the world.
ClassFlow
Class Flow: Data Analysis Using Graphing
[Free Registration/Login Required] This flipchart allows students to analyze data using appropriate graphs, including pictographs, histograms, bar graphs, line graphs, circle graphs, and line plots introduced earlier, and using...
E-learning for Kids
E Learning for Kids: Math: Pizza (Italian) Restaurant: Data and Chance
In this interactive site, students practice with bar and picture graphs by helping a pizza place collect and analyze their data.


