Hi, what do you want to do?
PBS
Pbs Learning Media: Graphs, Charts, and Tables: Targeted Math Instruction
At the end of this lesson about graphs, charts, and tables, students will be able to interpret and compare data from graphs (including circle, bar, and line graphs), charts, and tables.
E-learning for Kids
E Learning for Kids: Math: Elephant Plant: Data and Graphs
On this interactive website students practice various math skills using a real-life scenario involving plants. Those skills include interpreting data in a circle graph, interpreting data in a divided bar graph, and interpreting a bar...
E-learning for Kids
E Learning for Kids: Math: Group of Pyramids: Fractions and Graphs
On this interactive website, students practice various math skills using a real-life scenario at the pyramids. Those skills include showing percentages as fractions and decimals and interpreting data in a sector graph.
Texas A&M University
Wtamu Virtual Math Lab: Beginning Algebra: Reading Graphs
A good introduction to reading bar, line, and double line graphs, and drawing and reading Venn diagrams. Contains definitions and examples of these types of charts and graphs as well as practice exercises that ask you to answer questions...
Scholastic
Scholastic: Bars, Lines, and Pies
Students will learn and reinforce skills for creating, applying and analyzing pie charts, bar graphs and line graphs.
PBS
Pbs Kids Afterschool Adventure!: Operation: All About Us Activity Plan
It's time to stand in the spotlight! During this Afterschool Adventure, children will learn about and practice a variety of math skills as they gather information about their favorite subject-themselves! Children will start out by...
PBS
Pbs Learning Media: Everyday Algebra Plus: Targeted Math Instruction
Algebra lesson focuses on using patterns and relationships to write equations with two variables to represent relationships and patterns in real-world problems, plotting ordered pairs on a coordinate grid, and interpreting the meaning of...
Beacon Learning Center
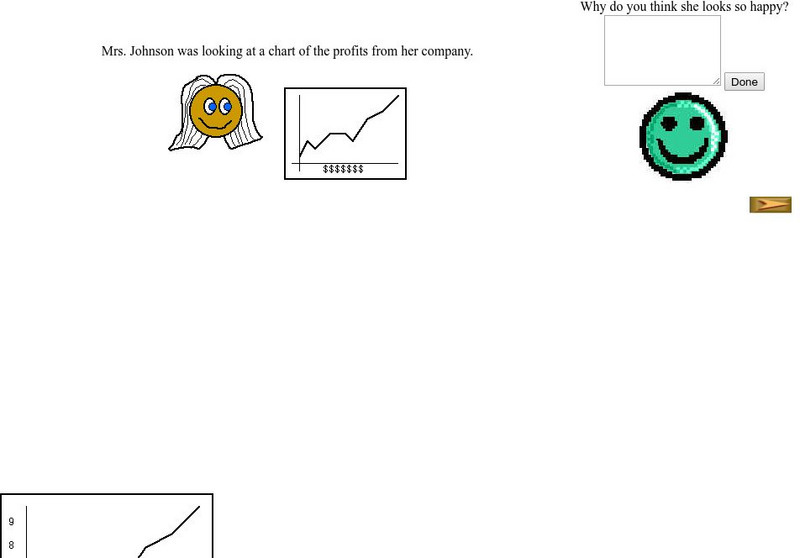
Beacon Learning Center: Interpreting Line Graphs
This site is a lesson on creating and interpreting a line graph. It explains how a line graph is created and then asks questions about what is learned from the data. Students type in open responses, and answers and feedback follow.
University of Cambridge
University of Cambridge: Maths and Sports: Match the Matches
Decide which charts and graphs represent the number of goals two football teams scored in fifteen matches. This data handling activity is designed to get children talking meaningfully about mathematics, presenting and justifying...
McGraw Hill
Glencoe: Self Check Quizzes 2 Circle Graphs
Use Glencoe's Math Course 2 randomly generated self-checking quiz to test your knowledge of circle graphs. Each question has a "Hint" link to help. Choose the correct answer for each problem. At the bottom of the page click the "Check...
Other
Delta State University: Lesson Plan 3: Pie Graphs
The students will gather, organize, and display data in an appropriate pie (circle) graph using M&M's! [PDF]
McGraw Hill
Glencoe: Self Check Quizzes 1 Circle Graphs
Use Glencoe's randomly generated self-checking quiz to test your knowledge of circle graphs. Each question has a "Hint" link to help. Choose the correct answer for each problem. At the bottom of the page click the "Check It" button and...
Math Planet
Math Planet: Pre Algebra: Circle Graphs
Learn about circle graphs or pie charts through examples and a video lesson.
Purple Math
Purplemath: Graphing Linear Equations: T Charts
A nice tutorial on how to graph linear equations. Goes through the process step by step and gives numerous examples.
The Math League
The Math League: Using Data and Statistics: Pie Charts
This introductory tutorial about statistical graphing with four examples of how pie charts (circle graphs) are constructed and read.
University of Cambridge
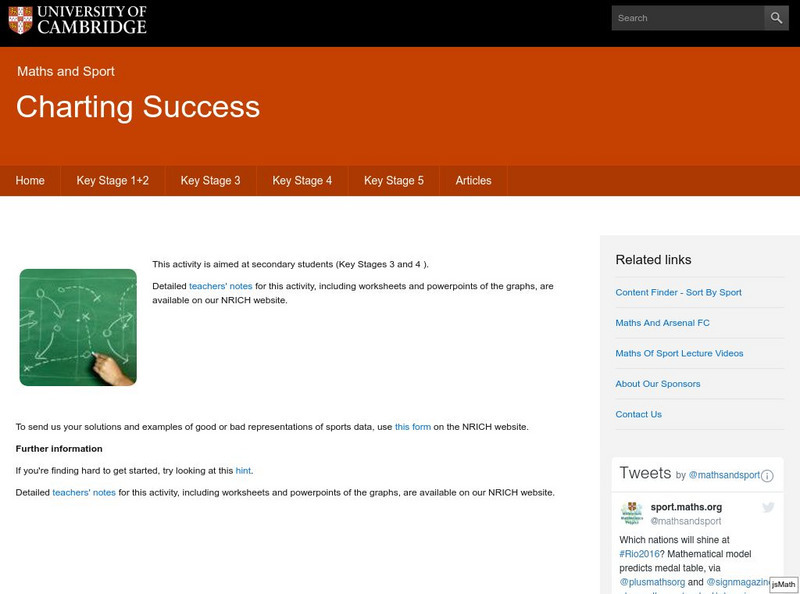
University of Cambridge: Maths and Sports: Charting Success
Sports statisticians, trainers and competitors create graphs, charts and diagrams to help them to analyse performance, inform training programmes or improve motivation. This activity encourages students to consider and analyse...
Math Is Fun
Math Is Fun: Data Graphs
Create and customize a bar graph, line graph, or pie chart based on a set of data and print it out.
Math Is Fun
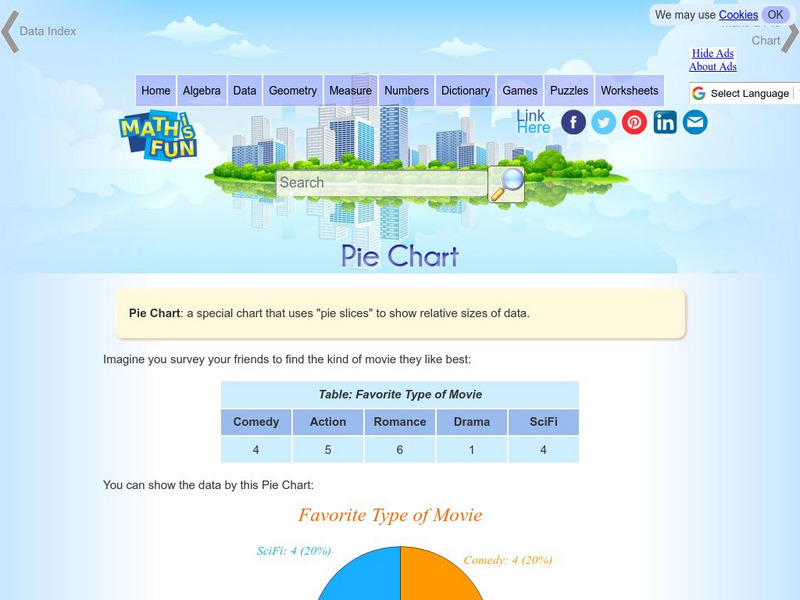
Math Is Fun: Pie Chart
Explains, with examples, what a pie chart is and how to make one. Includes a set of practice questions.
Other
Nearpod: Graphing Equations Using a Table
In this lesson plan on graphing equations using a table, students will learn how to create a table for a function in terms of domain and range and then graph the function on the coordinate plane.
ClassFlow
Class Flow: Interpreting Tables and Graphs
[Free Registration/Login Required] Explore a variety of graphs and tables. Many activities are incorporated to provide practice solving problems using different graphs and charts.
Oswego City School District
Regents Exam Prep Center: Practice With Organizing and Interpreting Data
Several problems are presented to test your skills in creating and interpreting frequency tables, pie charts, box-and-whisker and stem-and-leaf plots.
United Nations
Unesco: Math Games (In Arabic)
This site offers games and lessons that teach basic math concepts such as area and volume, number patterns, time, etc. Games use familiar tasks such as shopping to reinforce math concepts. While the title of each page includes an English...
Wolfram Research
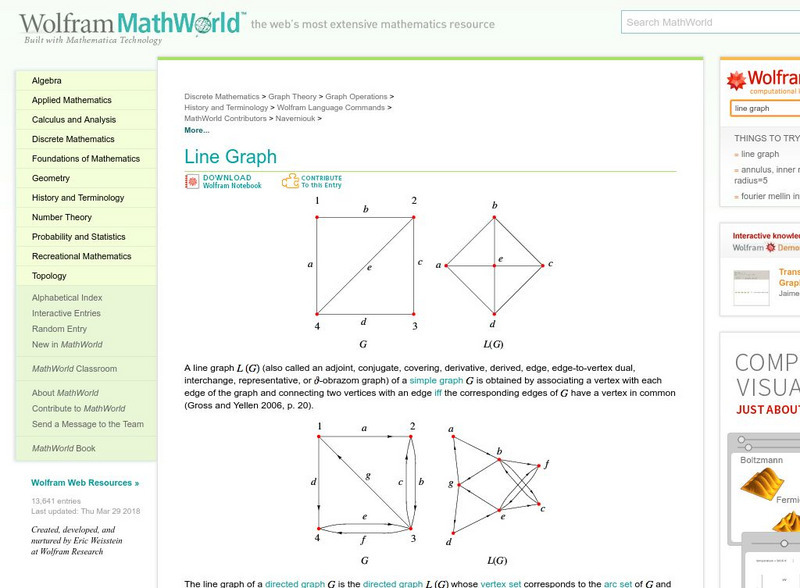
Wolfram Math World: Line Graph
Definition of a line graph with a variety of examples. Includes maps, charts, and detailed explanations for understanding.
Math Aids
Math Aids: Graph Worksheets
Great resource to practice and strengthen math skills pertaining to graphs. Math worksheets are printable, may be customized, and include answer keys.


