Science Education Resource Center at Carleton College
Serc: Exploring Regional Differences in Climate Change
Students create a set of graphs that facilitate comparison of climate change predicted for various states. They also use Microsoft Excel to create a graph showing precipitation data.
National Earth Science Teachers Association
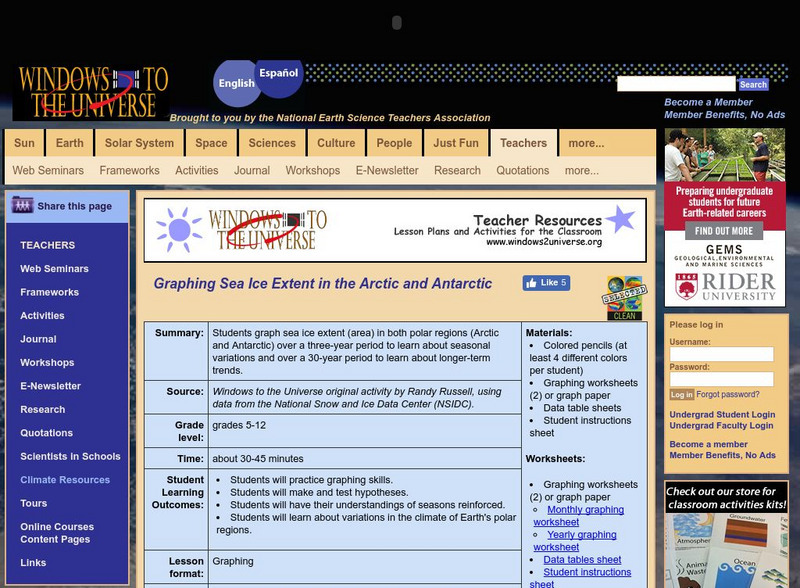
Windows to the Universe: Graphing the Extent of Sea Ice in Arctic and Antarctic
Students graph sea ice extent in both polar regions over a three-year period to learn about seasonal variations, and over a 30-year period to learn about longer-term trends.
TeachEngineering
Teach Engineering: Engineering for the Earth
Young students are introduced to the complex systems of the Earth through numerous lessons on its natural resources, processes, weather, climate and landforms. Key earth science topics include rocks, soils and minerals, water and natural...
Science Education Resource Center at Carleton College
Serc: Do You Really Want to Visit the Arctic?
This jigsaw activity is designed for students to become familiar with several datasets of Arctic weather data, collected in Eureka on Ellesmere Island. Students join a role-playing activity to read and interpret graphs while considering...
University of Texas at Austin
University of Texas: Human Environmental Interactions [Pdf]
Inspired by Hemispheres' 2004 Teachers' Summer Institute, People and Place: Human-Geographic Relations, this curriculum unit was designed to address human adaptation to and modification of the environment. How have humans adjusted to...


![University of Texas: Human Environmental Interactions [Pdf] Lesson Plan University of Texas: Human Environmental Interactions [Pdf] Lesson Plan](https://d15y2dacu3jp90.cloudfront.net/images/attachment_defaults/resource/large/FPO-knovation.png)