Texas Education Agency
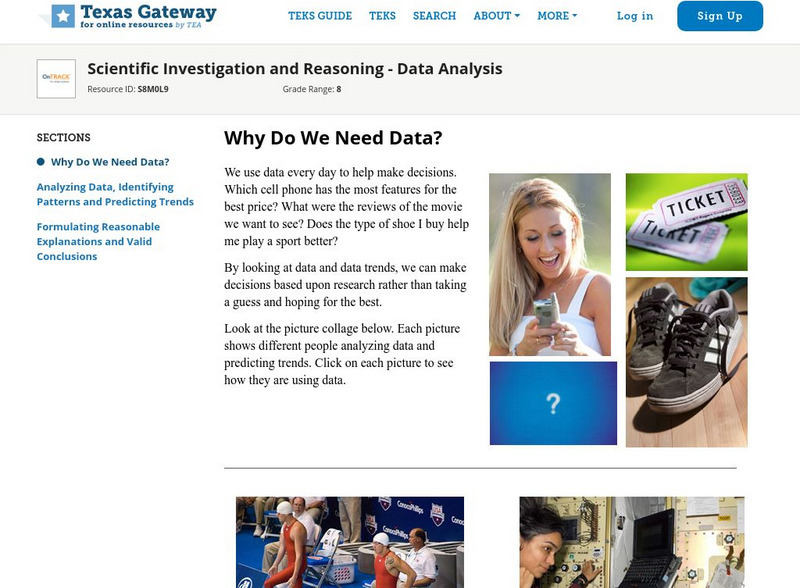
Texas Gateway: Why Do We Need Data?
We use data every day to help make decisions. Which cell phone has the most features for the best price? What were the reviews of the movie we want to see? Does the type of shoe I buy help me play a sport better?By looking at data and...
Vision Learning
Visionlearning: Data: Data Analysis and Interpretation
An explanation of data from collection to analysis. Includes a discussion of how the same data may be interpreted various ways by different individuals.
Vision Learning
Visionlearning: Data: Uncertainty, Error, and Confidence
An explanation of how errors may affect data that has been collected for experimentation. Some examples are given.
Other
Ocean Tracks: Fact or Artifact? Interpreting Patterns in Ocean Tracks Data [Pdf]
Ever wonder where marine animals go? How fast they swim? How deep they dive? Electronic tagging has opened a new window into the world of the open ocean. Ocean Tracks gives you access to data collected by tags on real live migrating...
Texas Education Agency
Texas Gateway: Scientific Investigation and Reasoning Data Organization
Using interactive exercises, students will review how to construct tables and graphs in order to organize data.
Science Buddies
Science Buddies: Interpreting Area Data From Maps vs. Graphs
Graphical methods of data presentation are a key feature of scientific communication. This project asks the question, "What's the best way to compare the land area of states: a map or a bar graph?" You'll be measuring performance on two...
National Center for Ecological Analysis and Synthesis, University of California Santa Barbara
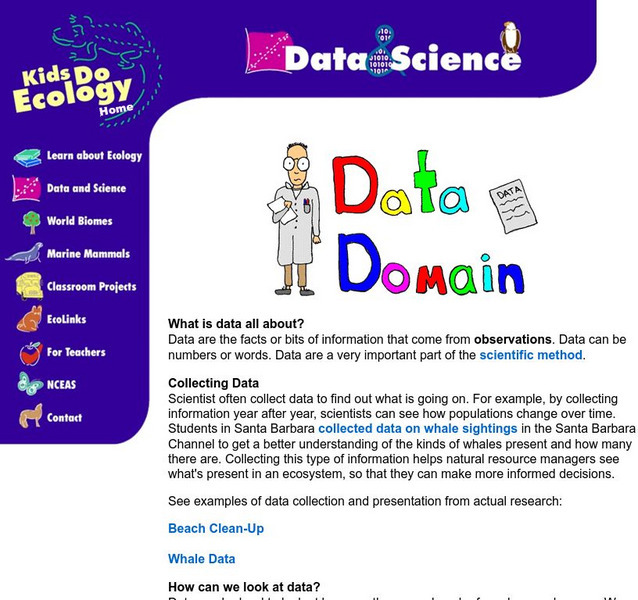
Kids Do Ecology: Data and Science
Learn about conducting your own investigation with these tips on following the scientific method. Find out how to state hypothesis, make observations, collect and analyze data, and display data to share results and conclusions of your...
Science Buddies
Science Buddies: Scientific Method Data Analysis/graphs
At the end of your experiment you should review all of the data you have collected. See samples of data analysis charts and graphs. Find out what makes for a good chart or graph using the self-grading rubrics.
University of Illinois
University of Illinois: Data Types
The University of Illinois provides this site that is helpful because of the various kinds of data that can be collected. This lesson plan helps students differentiate between qualitative, quantitative, and many other types of data.
BSCS Science Learning
Bscs: Invitations to Inquiry With Data Using Field Scope
Invitations to Inquiry are short instructional activities designed to help middle and high school students work with large data sets. Teachers and students use the interactive FieldScope platform to collect, visualize, and analyze...
Climate Literacy
Clean: Mauna Loa Co2 Collection Data
This data-intensive activity uses real world datasets to cover topics such as weather v. climate, air circulation around the globe, seasonal effects, and climate change.
Science Education Resource Center at Carleton College
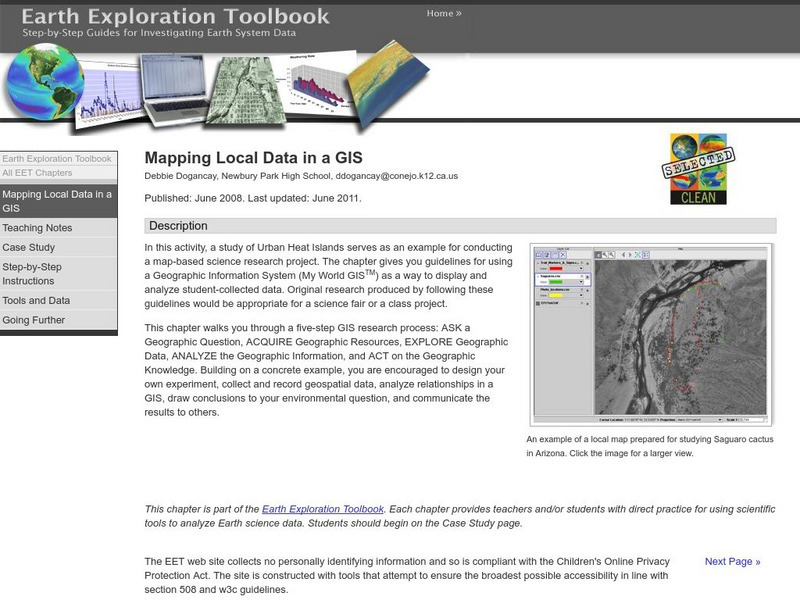
Serc: Mapping Local Data in a Gis
In this activity, students will learn how to conduct a map-based science research project using a Geographic Information System (GIS). They will design an experiment, collect and record geospatial data, analyze geospatial relationships...
City University of New York
Scientific Method and Probability: Interactive Activity
This interactive lesson begins with the basics and carries through to methods of data analysis, all interactively. Supporting material is excellent.
Vision Learning
Visionlearning: General Science: The Scientific Method
Instructional module focusing on the scientific method as a process of investigation into the natural world rather than a linear collection of facts. Site also includes an interactive practice quiz and links relating to the topic.
Other
Brebeuf Jesuit Preparatory School: The Scientific Method (Part 3) [Pdf]
Explains how to collect and organize data for an experiment. Describes how to make a table and graph the data, and when to use different types of graphs. Next, it discusses which variable should be on the x- or y-axis of a graph, and how...
National Center for Ecological Analysis and Synthesis, University of California Santa Barbara
Nceas: What Are Data?
This site from NCEAS answers many questions about data. You can also learn about data, tables, and types of graphs in this informative site.
University of Washington
Washington U: Model for Conducting Scientific Research
This page outlines the scientific method, step by step.
CK-12 Foundation
Ck 12: Episd: Physics: 1.8 Working With Error
[Free Registration/Login may be required to access all resource tools.] This learning opportunity examines two angles of working with error. Students will practice taking measurements with accuracy and precision and then consider the...
Center for Innovation in Engineering and Science Education, Stevens Institute of Technology
Ciese Collaborative Projects: International Boiling Point Project
An Internet project designed to determine the greatest influence on the boiling point. After reading the project instructions and performing the experiment, submit your data and compare your results to other classes from around the world.
BSCS Science Learning
Bscs: Heavy Metals in Waterways
This inquiry focuses on heavy metals in waterways in Colorado. Students will learn about heavy metals and data collected about them from citizen scientists, and then analyze the data in tables and maps to identify possible evidence of...
Science Buddies
Science Buddies: An Experiment in Visual Perception
Graphical methods of data presentation are a key feature of scientific communication. This project will get you thinking about how to find the best way to communicate scientific information.
Songs for Teaching
Songs for Teaching: Scientific Method Blues
This lesson plan introduces the scientific method to your students through song. Students will learn the steps of the scientific method through this great song written by Kathleen Carroll. Click on the link and play it for your whole class.
University of Arizona
Environmental Tobacco Smoke and Lung Development Activity
An interactive activity designed for you understand the scientific method and how to analyze your data. A step-by-step and personalized experiment geared toward the topic of toxicology.
BSCS Science Learning
Bscs: Frog Eat Frog World
Using maps and graphs of large data sets collected in FrogWatch, learners will determine the range, preferred land cover, and proximity to water of the American bullfrog to figure out the bullfrog's requirements for food, water, and...


![Ocean Tracks: Fact or Artifact? Interpreting Patterns in Ocean Tracks Data [Pdf] Lesson Plan Ocean Tracks: Fact or Artifact? Interpreting Patterns in Ocean Tracks Data [Pdf] Lesson Plan](https://d15y2dacu3jp90.cloudfront.net/images/attachment_defaults/resource/large/FPO-knovation.png)

