Hi, what do you want to do?
New York State Education Department
TASC Transition Curriculum: Workshop 4
Why is it important to use precise language? Participants explore this question in the fourth activity in a series of 15 on effective instruction. Perfect for all content areas, the activity promotes appropriate language choice through...
Vision Learning
Visionlearning: Data: Using Graphs and Visual Data in Science
An explanation of how data can be turned into visual forms which can help people comprehend information easier than observing numbers.
Texas Education Agency
Texas Gateway: Scientific Investigation and Reasoning Data Organization
Using interactive exercises, students will review how to construct tables and graphs in order to organize data.
Texas Education Agency
Texas Gateway: Why Do We Need Data?
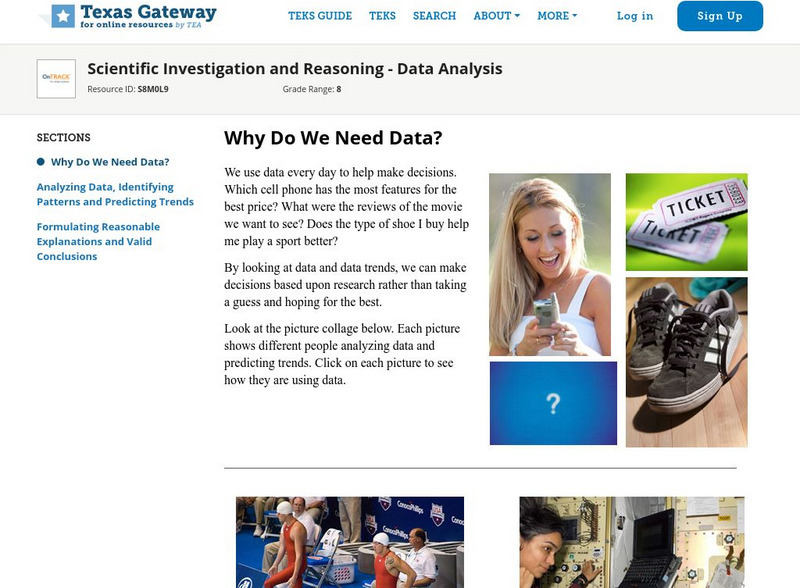
We use data every day to help make decisions. Which cell phone has the most features for the best price? What were the reviews of the movie we want to see? Does the type of shoe I buy help me play a sport better?By looking at data and...
Stanford University
Dreme: Data in the Preschool Classroom
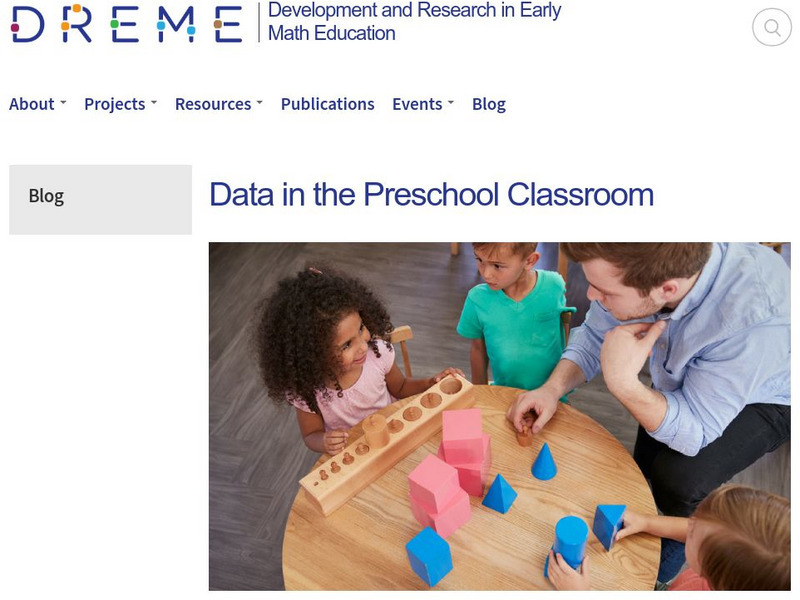
What are the important concepts involved in data collection and data use in the preschool classroom, and how can teachers support the mathematics of data? This article gives a brief description of the concepts that children need to grasp...
National Council of Teachers of Mathematics
The Math Forum: Seventh Grade Mathematics: Data Sense
This site has some interesting ways to collect and evaluate data. There are some activities about note taking, spreadsheets, surveys, and a cool bridge construction project. Teachers may want to use this site as a resource for some...
Center for Innovation in Engineering and Science Education, Stevens Institute of Technology
Ciese Real Time Data Projects: Weather Scope: A Study of Weather and Climate
Use real-time data to study factors that affect weather and climate, create weather instruments, and share data with students around the world.
Concord Consortium
Common Online Data Analysis Platform (Codap)
CODAP is a free, easy-to-use data analysis environment for students. Students can load their own data into an easy-to-use web-based data analysis tool to create their own datasets, share visualizations, and discover data-driven insights....
Google
Google for Education: Using Data From Sensors
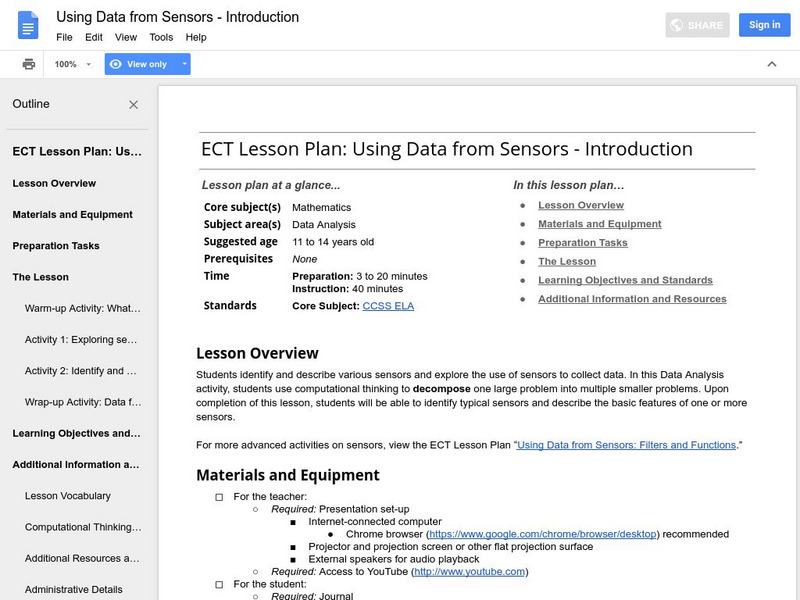
Students analyze data gathered from sensors and develop filtering algorithms for anomalies and outliers, then use these algorithms to make decisions on sensor data as it is being collected.
Google
Google for Education: Data Aggregation and Decomposition (Python)
Learners learn how to use and analyze data to draw conclusions about information collected from classmates. Then they use computational thinking by collecting and aggregating data onto a spreadsheet, identifying patterns in their data,...
REMC Association of Michigan
Remc Association of Michigan: 21 Things4 Students: 13. Dig the Data
This tutorial contains ten quests. You will learn to create spreadsheets and charts, use formulas, and make decisions based on data. The first five quests has students plan a party and in the last five, they collect and analyze data for...
Texas Education Agency
Texas Gateway: Predicting, Finding, and Justifying Data From a Graph
Given data in the form of a graph, the student will use the graph to interpret solutions to problems.
Other
Ocean Tracks: Fact or Artifact? Interpreting Patterns in Ocean Tracks Data [Pdf]
Ever wonder where marine animals go? How fast they swim? How deep they dive? Electronic tagging has opened a new window into the world of the open ocean. Ocean Tracks gives you access to data collected by tags on real live migrating...
Google
Google for Education: Sorting Data
In this example students use data collected from their class and learn to sort it before calculating the mean, median, and mode. Additionally, students learn how to use spreadsheet functions to sort based on different criteria, leading...
Texas Instruments
Texas Instruments: Mc Dougal Littell Algebra 2: Collect, Model Trigonometric Data
Students will use the TI-84 Plus family to collect data from a microphone and analyze. Students' will then write a trig function to model the data.
Texas Education Agency
Texas Gateway: Data Organization
Given field and laboratory scenarios and laboratory data, students will construct data tables and graphs, using repeated trials and means to organize data.
Oswego City School District
Regents Exam Prep Center: Multiple Choice Practice: Working With Data
Test your knowledge of working with data by taking this twenty question multiple-choice practice test. Use a graphing calculator to help with any graphing problems and check your answers at any given time throughout the test.
Alabama Learning Exchange
Alex: M&m's and Blogs: Interpreting Data!
In this hands-on, technology-rich instructional activity, students will interpret data. The students will define words involving graphs, create a bar graph using M&M's, and post information from their findings on the internet. The...
Center for Innovation in Engineering and Science Education, Stevens Institute of Technology
Ciese Real Time Data Projects: The Stowaway Adventure
Through this series of Internet-based learning experiences and activities, learners will use real-time data to track a real ship at sea and monitor weather conditions. Includes a teacher's guide with problem-solving lesson plans...
Texas Education Agency
Texas Gateway: Selecting and Using Representations for Collected Data
[Accessible by TX Educators. Free Registration/Login Required] Given a variety of data (including line plots, line graphs, stem and leaf plots, circle graphs, bar graphs, box and whisker plots, histograms, and Venn diagrams), the student...
Oswego City School District
Regents Exam Prep Center: Displaying Data
Use this lesson, practice exercise, and teacher resource in planning instruction on displaying data. In the lessons, you'll find definitions and examples of ways to collect and organize data, quartiles, and box-and-whisker plots, as well...
US Environmental Protection Agency
Epa: Air Data
The AirData website gives you access to air quality data collected at outdoor monitors across the United States, Puerto Rico, and the U. S. Virgin Islands. The data comes primarily from the AQS (Air Quality System) database. You can...
NASA
Nasa: Precipitation Towers: Modeling Weather Data
This lesson uses stacking cubes as a way to graph precipitation data, comparing the precipitation averages and seasonal patterns for several locations. Variations on the lesson can accommodate various ages and ability levels. Young...
Science Buddies
Science Buddies: Scientific Method Data Analysis/graphs
At the end of your experiment you should review all of the data you have collected. See samples of data analysis charts and graphs. Find out what makes for a good chart or graph using the self-grading rubrics.


