College Board
AP® Psychology: Teaching Statistics and Research Methodology
Psychologists use statistics? Scholars investigate the research behind the methodology of statistical analysis. Using hands-on practice, case-studies, and scatterplots, they complete various tasks to understand the very roots of high...
New York State Education Department
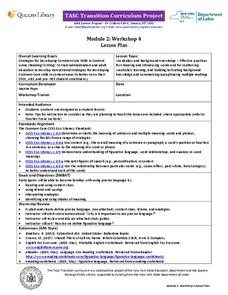
TASC Transition Curriculum: Workshop 4
Why is it important to use precise language? Participants explore this question in the fourth activity in a series of 15 on effective instruction. Perfect for all content areas, the activity promotes appropriate language choice through...
Missouri Department of Elementary
R-E-S-P-E-C-T: A Basic Skill
Imagine seventh graders developing a school wide plan to promote respect in their school. That's the vision behind the second lesson in the R-E-S-P-E-C-T series. In preparation for designing a school-wide media campaign, class members...
EngageNY
TASC Transition Curriculum: Workshop 15
What do a cheetah, Audi commercial, and air have in common? They're all topics of an engaging inquiry-based, hands-on workshop for educators about background knowledge, reading strategies, the CER model, and argumentative writing. The...
Illustrative Mathematics
Illustrative Mathematics: S Id.3 Describing Data Sets With Outliers
For certain data sets, such as home prices and household or individual income, is often described using the median instead of the mean. This instructional activity explores the mean and median in some different situations to help you...
Cuemath
Cuemath: Discrete Data
A comprehensive guide for learning all about discrete data with definitions, the difference between discrete and continuous data, graphical representation of discrete data through visualization, solved examples, and interactive questions...
Khan Academy
Khan Academy: Storing Data Sets
Find out how to store data sets in the analysis of data.
Khan Academy
Khan Academy: Finding Patterns in Data Sets
Check your understand of the ways you can find patterns in data sets (like trends and correlations) in this set of free practice questions designed for AP Computer Science Principles students.
Texas Education Agency
Texas Gateway: Quantitative vs. Qualitative Data
This lesson explores quantitative vs. qualitative scientific data.
Concord Consortium
Common Online Data Analysis Platform (Codap)
CODAP is a free, easy-to-use data analysis environment for students. Students can load their own data into an easy-to-use web-based data analysis tool to create their own datasets, share visualizations, and discover data-driven insights....
Khan Academy
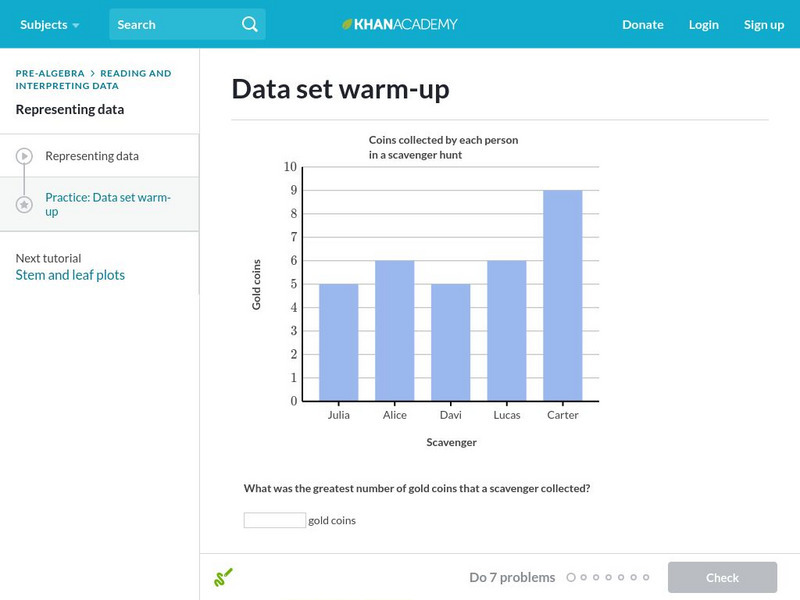
Khan Academy: Data Set Warm Up
Begin your journey into the world of statistics with some warm-up questions about data sets. Students receive immediate feedback and have the opportunity to try questions repeatedly, watch a video or receive hints.
TED Talks
Ted: Ted Ed: David Mc Candless: The Beauty of Data Visualization
Listen and watch as David McCandless turns complex data sets into beautiful, simple diagrams. He suggests that information design is really important because we all like to visualize our information. [18:19]
Khan Academy
Khan Academy: Finding Patterns in Data Sets
Explore examples of patterns that we can find in the data around us.
Khan Academy
Khan Academy: Finding Patterns in Data Sets
Explore examples of patterns that we can find in the data around us with these practices problems.
BSCS Science Learning
Bscs: Invitations to Inquiry With Data Using Field Scope
Invitations to Inquiry are short instructional activities designed to help middle and high school students work with large data sets. Teachers and students use the interactive FieldScope platform to collect, visualize, and analyze...
CK-12 Foundation
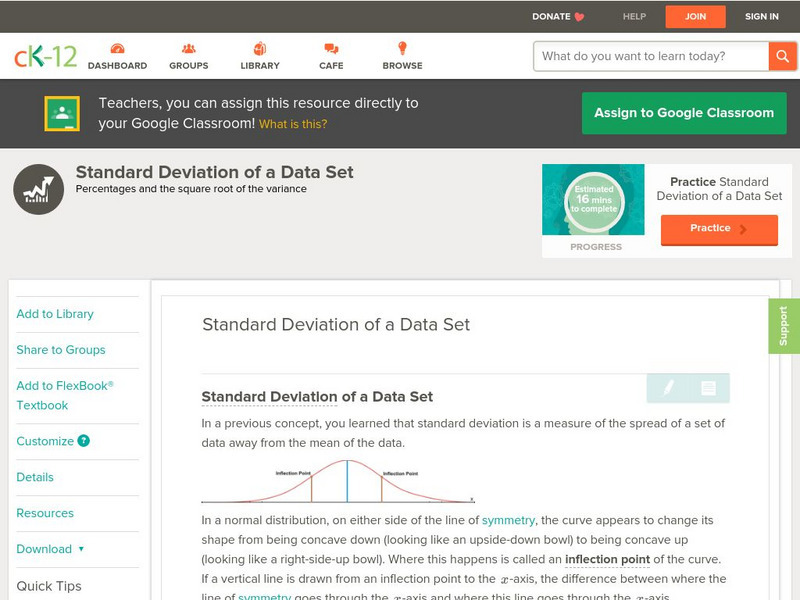
Ck 12: Statistics: Standard Deviation of a Data Set
[Free Registration/Login may be required to access all resource tools.] Learn about standard deviation of normally distributed data.
Texas Education Agency
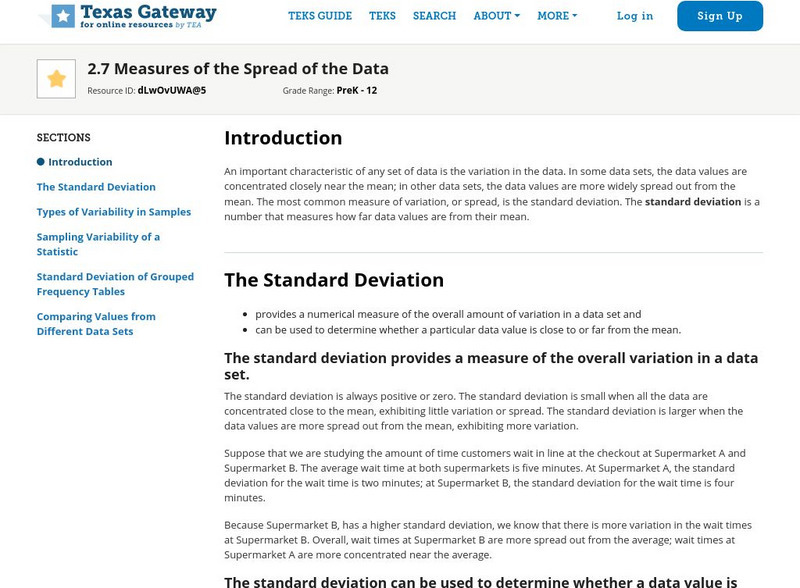
Texas Gateway: Tea Statistics: Measures of the Spread of the Data
This resource explains the different measures of center, variability, etc. that are used to describe the spread of statistical data. Includes examples and practice exercises.
Other
Nearpod: Introduction to Data Representation
In this lesson on representation data, young scholars explore how to make dot plots, histograms, and box plots and learn about outliers in a data set.
Khan Academy
Khan Academy: Big Data
Check your understanding of large data sets (big data) in this set of free practice questions designed for AP Computer Science Principles students.
Texas Instruments
Texas Instruments: Describing Categorical Data
Students analyze the distribution of categorical data. They calculate percents and visually compare the data sets with a bar chart.
Mangahigh
Mangahigh: Data: Understand Discrete and Continuous Data
This site provides students practice with the concept of discrete and continuous data. Students can learn about the topic by completing an interactive tutorial. Students can then take a ten question timed test to practice the skill.
Shodor Education Foundation
Shodor Interactivate: Comparison of Univariate and Bivariate Data
Students learn about the difference between univariate and bivariate data and understand how to choose the best graph to display the data.
Next Gen Personal Finance
Next Gen Personal Finance: Managing Credit Data Crunch
Data Crunches feature one chart or graph followed by five scaffolded questions to guide students through analyzing the data and drawing conclusions. These sets of data help students understand financial concepts.
Next Gen Personal Finance
Next Gen Personal Finance: Saving Data Crunch
Data Crunches feature one chart or graph followed by five scaffolded questions to guide students through analyzing the data and drawing conclusions. These sets of data help students understand financial concepts.
Other popular searches
- Comparing Two Data Sets
- Comparing Sets of Data
- Comparing Related Data Sets
- Comparing Two Sets of Data

