Hi, what do you want to do?
Better Lesson
Better Lesson: Line Me Up. Analyzing and Creating Line Graphs
Line graphs are used in our daily lives to show change over time.
Beacon Learning Center
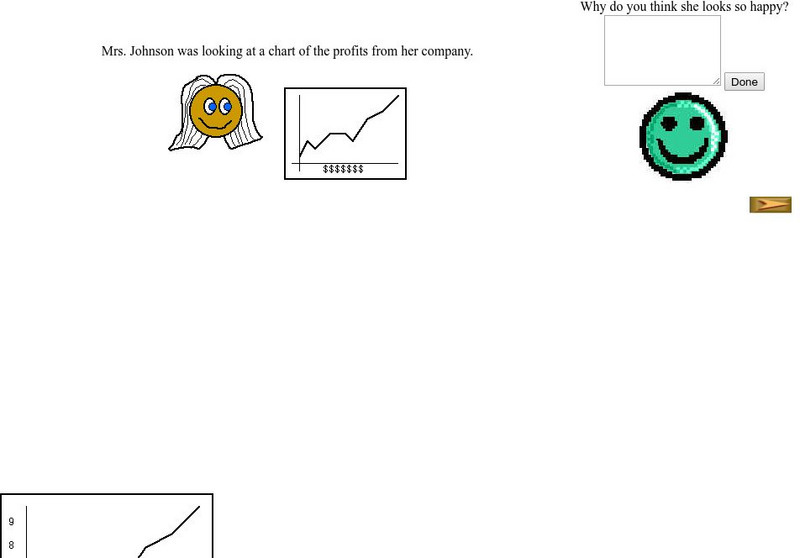
Beacon Learning Center: Interpreting Line Graphs
This site is a lesson on creating and interpreting a line graph. It explains how a line graph is created and then asks questions about what is learned from the data. Students type in open responses, and answers and feedback follow.
Cuemath
Cuemath: Line Graphs
A comprehensive guide for learning all about line graphs with definitions, their sections, how to read and create graphs, solved examples, and practice questions.
CK-12 Foundation
Ck 12: Statistics: Broken Line Graphs
[Free Registration/Login may be required to access all resource tools.] Covers creating and interpreting broken-line graphs.
US Department of Education
National Center for Education Statistics: Create a Graph Tutorial
This tutorial walks students through how to create different types of graphs using the Create a Graph tool available on the website. Covers bar graphs, line graphs, pie charts, area graphs, scatter plots, and dependent and independent...
CK-12 Foundation
Ck 12: Statistics: Line Graphs to Display Data Over Time
[Free Registration/Login may be required to access all resource tools.] Create line graphs to display how data changes over time.
Scholastic
Scholastic: Bars, Lines, and Pies
Middle schoolers will learn and reinforce skills for creating, applying and analyzing pie charts, bar graphs and line graphs.
US Department of Education
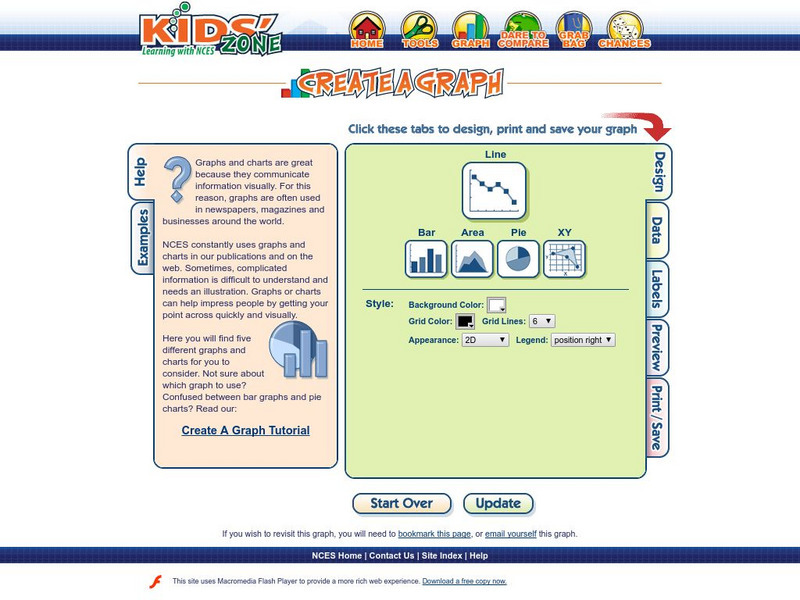
Nces: Create a Graph: Kids Zone
Make your own pie, bar, line, area or XY graph with this interactive tool. Look for examples of graphs already created from data collected by the National Center for Education Statistics. Complete with a graphing tutorial.
US Department of Education
Nces: Create a Graph: Line Graph
This resource from the National Center for Education Statistics provides tools for creating line graphs right online! Select a type of graph, fill in the information, and voila! -- you have created a wonderful graph all your own!
The Franklin Institute
Frankin Institute Online: Group Graphing
This site from The Franklin Institute explores how to make a simple graph using a spreadsheet to portray survey data. It also gives a set of interesting sports-related web sites so that students can get statistical inforamtion.
Khan Academy
Khan Academy: Make Line Plots
Practice creating line plots (dot plots) from data sets. Students receive immediate feedback and have the opportunity to try questions repeatedly, watch a tutorial video, or receive hints.
Math Is Fun
Math Is Fun: Data Graphs
Create and customize a bar graph, line graph, or pie chart based on a set of data and print it out.
Khan Academy
Khan Academy: Make Bar Graphs 1
Practice creating bar graphs (bar charts) from data sets. Students receive immediate feedback and have the opportunity to try questions repeatedly, watch a video or receive hints.
Better Lesson
Better Lesson: Class Surveys and Graphs
Young scholars love graphing data that they "own". In this plan, the class will select a type of graph and create it using a class survey frequency table. Included in this lesson plan are videos of the class engaged in the lesson plan...
Other
Desmos: Water Line
In this real-world activity, students draw a graph of the height of water in a glass as water is being poured into it. They next make their own glass, create an accurate graph for it, and add it to a cupboard of glasses shared by...
Khan Academy
Khan Academy: Graph Data on Line Plots
Record measurements on line plots (also called dot plots). Students receive immediate feedback and have the opportunity to try questions repeatedly, watch a video or receive hints.
US Department of Education
Nces Kids: Creating an Area Graph
This is where you will find step by step directions explaining how to create an area graph. Complete each step and click on the next tab. Directions are simple and clear.
Concord Consortium
Concord Consortium: Stem Resources: Building a Zip Line
For this interactive, students plan, create, and test a zip line that will transport a hard-boiled egg without breaking it. They will make improvements on their design based on data about its performance. A motion sensor is required in...
Alabama Learning Exchange
Alex: "Ridin' Along in My Automobile"
Students will research prices of used cars to discover how automobiles lose their value over time. Students will create a chart to record their information, use their chart to graph their data, and find measures of central tendency of...
University of Colorado
University of Colorado: Ph Et Interactive Simulations: Least Squares Regression
Create your own scatter plot or use real-world data and try to fit a line to it. Explore how individual data points affect the correlation coefficient and best-fit line.
Education Place
Houghton Mifflin: Eduplace: Make a Living Bar Graph
Student use simple data to line up in a living bar graph activity when they respond to simple questions in this lesson plan. They physically and visually represent the data. CCSS.Math.Content.3.MD.B.3 Draw a scaled picture graph and a...
Alabama Learning Exchange
Alex: Great Golly Graphs
This lesson plan asks learners to create a survey project including graphs, questions, tables, and data analysis. It gives an assessment and ideas for remediation and extension as well as ways to manage behavior problems and reluctant...
University of South Florida
Fcat: Human Number Line: Teacher Notes
This activity allows students to physically create a number line and work on adding and subtracting integers. This lesson can be adapted to include other concepts with real numbers.


