Khan Academy
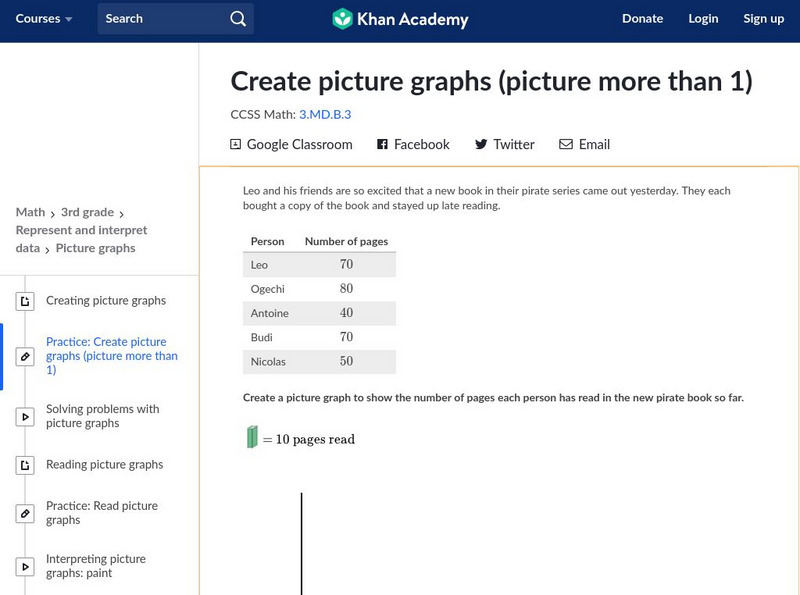
Khan Academy: Create Picture Graphs (Picture More Than 1)
Create and interpret picture graphs. Students receive immediate feedback and have the opportunity to try questions repeatedly, watch a video tutorial, or receive hints about how to create picture graphs. CCSS.Math.Content.3.MD.B.3 Draw a...
Khan Academy
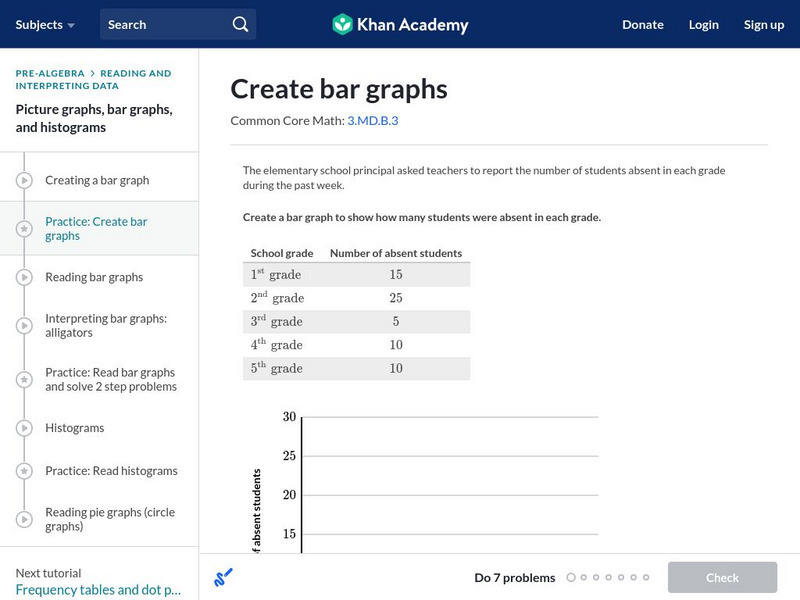
Khan Academy: Create Bar Graphs
Create a bar graph with the data given. Students receive immediate feedback and have the opportunity to try questions repeatedly, watch a video tutorial, or receive hints about creating bar graphs. CCSS.Math.Content.3.MD.B.3 Draw a...
University of Vienna (Austria)
The Graphs of Sin, Cos, and Tan Maths Online
This applet allows the user to create the graphs of sin, cos, and tan by moving a scroll bar. The user can watch the unit circle and the graph simultaneously to see how the two are related. The user may also choose to see the angle...
Khan Academy
Khan Academy: Make Bar Graphs 1
Practice creating bar graphs (bar charts) from data sets. Students receive immediate feedback and have the opportunity to try questions repeatedly, watch a video or receive hints.
Texas Instruments
Texas Instruments: Math Today the Next Frontier for Flight
This activity provides students the opportunity to gain experience in creating circle graphs on the calculator and provides an excellent real-world review of computation with percents.
Beacon Learning Center
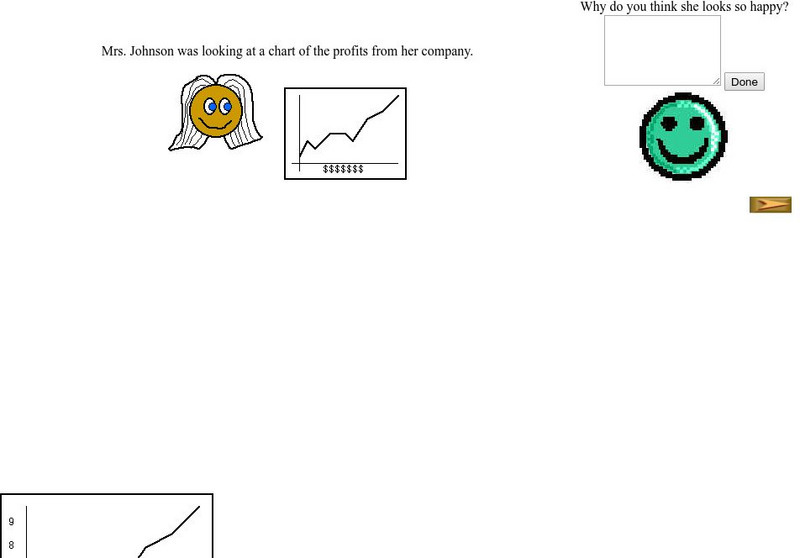
Beacon Learning Center: Interpreting Line Graphs
This site is a lesson on creating and interpreting a line graph. It explains how a line graph is created and then asks questions about what is learned from the data. Students type in open responses, and answers and feedback follow.
ArtsNow
Arts Now Learning: We Are Living Graphs and Data [Pdf]
In this lesson, 3rd graders use their own bodies to create bar graphs and do problems involving addition, subtraction, and more or less amounts. They then create their own graphs, incorporating the features of graphs that they have...
Khan Academy
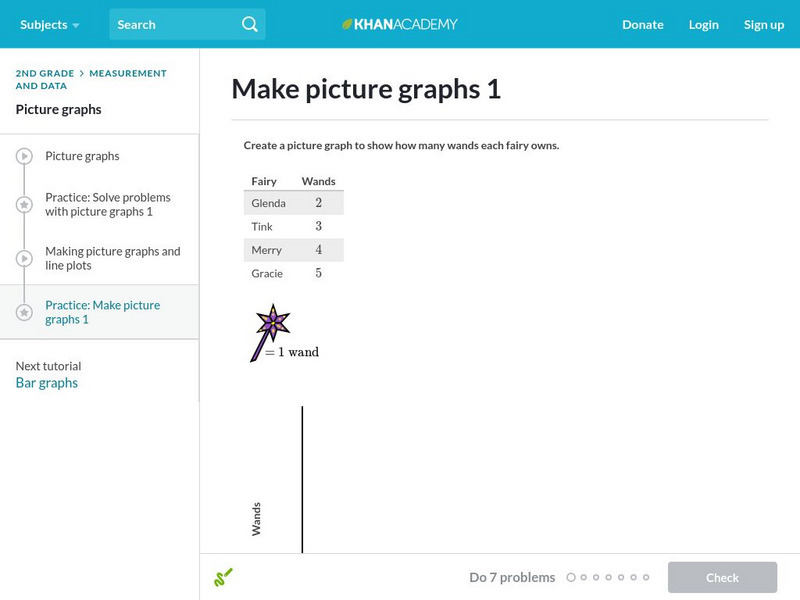
Khan Academy: Make Picture Graphs 1
Practice creating picture graphs (pictographs) from data sets. Students receive immediate feedback and have the opportunity to try questions repeatedly, watch a video or receive hints.
Rice University
Rice University: Cynthia Lanius: Let's Graph
An introduction to bar graphs, both vertical and horizontal in nature. The interactive aspect of this site allows students to change the values of the data - their favorite cafeteria foods - and then see how the graph is changed.
E-learning for Kids
E Learning for Kids: Math: Dinosaurs: Data and Chance
Students can play learning games to explore how to label, read, and create graphs using a dinosaur theme.
Texas Instruments
Texas Instruments: Math Today Challenge New Color of Money
In this activity, students will read about the changes in the "new money" and then create a graph to represent various combinations of currency produced. This activity provides an excellent example of discrete, real-world data.
Math Is Fun
Math Is Fun: Activity: An Experiment With a Die
Explore probability with this dice experiment. Includes instructions for recording data on a table, creating a graph, questions to investigate, a probability formula, and a discussion of probability.
Education Place
Houghton Mifflin: Eduplace: Make a Living Bar Graph
Student use simple data to line up in a living bar graph activity when they respond to simple questions in this lesson plan. They physically and visually represent the data. CCSS.Math.Content.3.MD.B.3 Draw a scaled picture graph and a...
University of Vienna (Austria)
University of Vienna: Maths Online
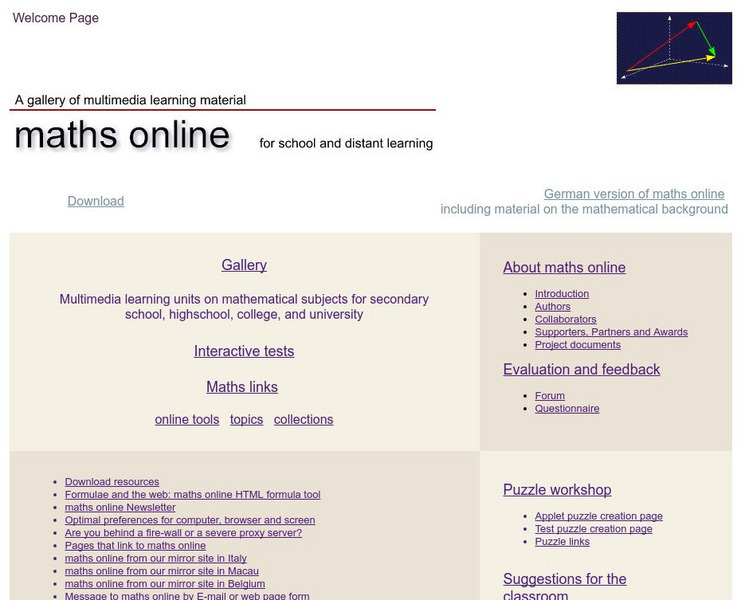
The University of Vienna, Austria, created this site to help bring the worlds of math and technology together. You have access to many applets and downloads that allow you to create lessons, tests, and puzzles. There are also great...
ABCya
Ab Cya: Fuzz Bugs Graphing
Students drag the fuzz bugs into the correct container to create a bar graph that is used to compare data.
Texas Instruments
Texas Instruments: Slippery Slope Activity: Math & Science in Motion
This activity serves as a follow-up to Activity 6 in the Explorations book, Math and Science in Motion: Activities for Middle School by Chris Brueningsen, Elisa Brueningsen, and Bill Bower (Texas Instruments Incorporated, 1997). Students...
Scholastic
Scholastic: Max's Math Adventures: A Hairy Situation
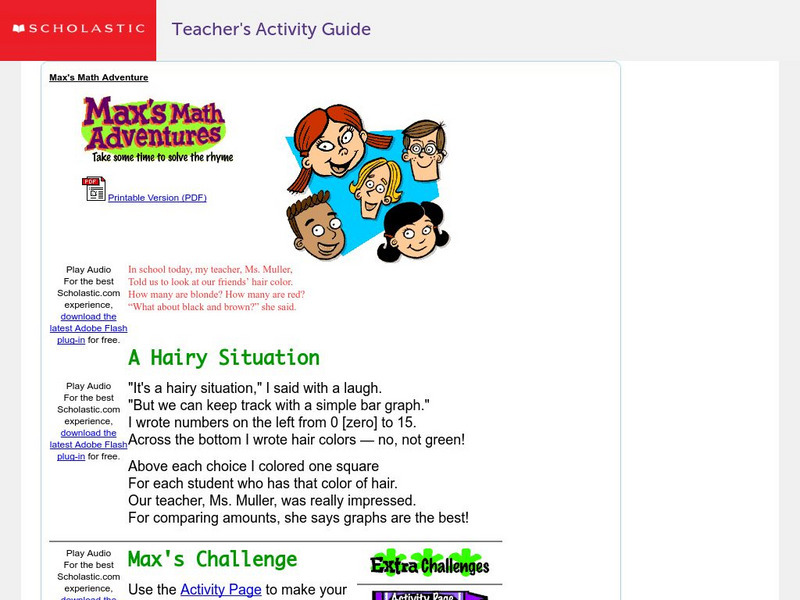
Help Max make a bar graph to show the hair colors of his classmates. Teachers will appreciate the activities with bar graphs in the extra challenges. Use the teacher's guide to create a fun and engaging lesson.
Math Graphs
Houghton Mifflin: Math Graphs: Combinations of Functions 13 [Pdf]
Students add two graphs together to create a new graph. The math graphs are available in PDF format.
Math Graphs
Houghton Mifflin: Math Graphs: Combinations of Functions 14 [Pdf]
Students add two graphs together to create a new graph. The math graphs are available in PDF format.
Math Graphs
Houghton Mifflin: Math Graphs: Transformations 9 [Pdf]
The practice problem examines how to create new graphs by transforming the original function. The math graph is available in PDF format.
Math Graphs
Houghton Mifflin: Math Graphs: Transformations 10 [Pdf]
The practice problem examines how to create new graphs by transforming the original function. The math graph is available in PDF format.
Math Graphs
Houghton Mifflin: Math Graphs: Combinations of Functions 27 [Pdf]
The exercise uses graphical addition to create a new function. The math graphs are available in PDF format.
Math Graphs
Houghton Mifflin: Math Graphs: Combinations of Functions 28 [Pdf]
The exercise uses graphical addition to create a new function. The math graphs are available in PDF format.
Math Graphs
Houghton Mifflin: Math Graphs: Percents and Circle Graphs 1 [Pdf]
Students calculate the percent of the total income for sources of income and expenses. Learners then use this information to create a circle graph. The handout is available in PDF format.
