Hi, what do you want to do?
Sophia Learning
Sophia: Creating Graphic Organizers
This tutorial focuses on creating graphic organizers for a variety of purposes. It presents the following types of organizers, their uses, and the format of each: the Cornell method, charting method, cause and effect organizers, flow...
Khan Academy
Khan Academy: Creating Dot Plots
Practice creating dot plots. Dot plots are very similar to frequency tables, but they make it easier to see the data. Students receive immediate feedback and have the opportunity to try questions repeatedly, watch a video or receive hints.
Khan Academy
Khan Academy: Make Line Plots
Practice creating line plots (dot plots) from data sets. Students receive immediate feedback and have the opportunity to try questions repeatedly, watch a tutorial video, or receive hints.
Khan Academy
Khan Academy: Creating Box Plots
More practice making box plots to summarize data sets. Students receive immediate feedback and have the opportunity to try questions repeatedly, watch a video or receive hints.
Better Lesson
Better Lesson: Box and Whiskers... Analyzing and Creating
The students will be using discovery techniques to learn about box and whisker plots.
Other
National Security Agency: Line Plots: Frogs in Flight [Pdf]
Students learn how to construct and interpret line plots. The lesson plan describes an activity that has students collect data, create line plots, and interpret and analyze the data.
CK-12 Foundation
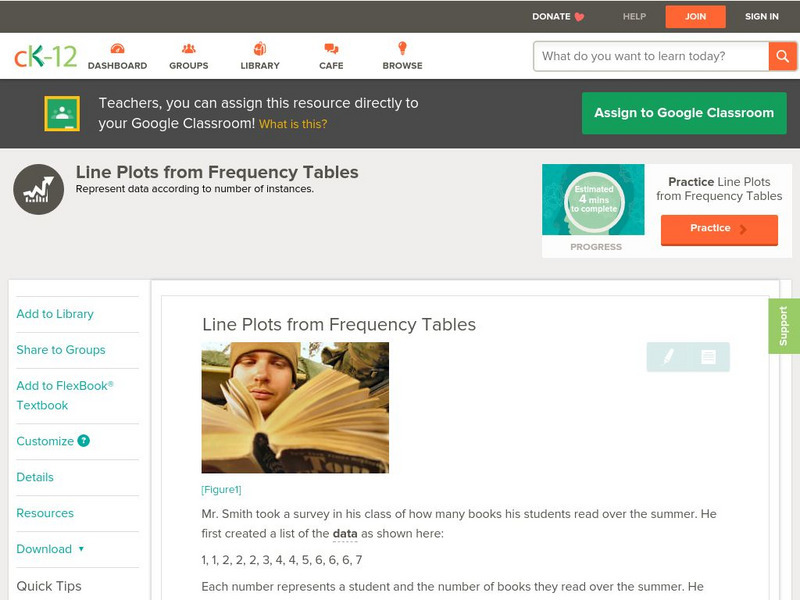
Ck 12: Statistics: Line Plots From Frequency Tables
[Free Registration/Login may be required to access all resource tools.] Create a line plot given data organized in a frequency table.
Khan Academy
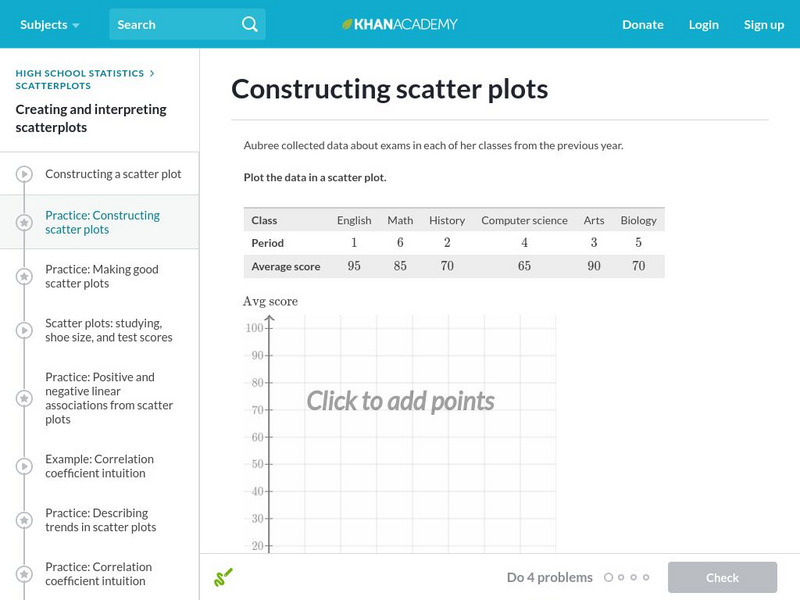
Khan Academy: Constructing Scatter Plots
Practice plotting points to construct a scatter plot. Students receive immediate feedback and have the opportunity to try questions repeatedly, watch a video, or receive hints.
Other
Nearpod: Displaying Data: Box Plots
In this instructional activity, students will learn how to create and intrepret box plots using the 5-number summary.
Texas Instruments
Texas Instruments: Create Box and Whisker Plots
Students use a graphing calculator to create box-and-whisker plots and learn the usefulness of them. Students identify the five summary statistical values of data sets - minimum, first quartile, median, third quartile, and maximum values.
Other
Mr maffesoli.com: Line Plot Worksheet C [Pdf]
Fifth graders will complete questions on a worksheet about line plots and will also create a line plot from given information.
Purple Math
Purplemath: Stem and Leaf Plots
Explains how to create a stem-and-leaf plot from a data set. Demonstrates how to format a clear stem-and-leaf plot.
Texas Instruments
Texas Instruments: Celebrity Plots
Students can use celebrity ages to find central tendency and create scatter plots.
Better Lesson
Better Lesson: Stem and Leaf Plots Activity
This activity is designed so that the students create their own Around the Room activity. They will be collecting data, displaying it in a stem and leaf plot, and then developing questions around their display for other students to answer!
Shodor Education Foundation
Shodor Interactivate: Box Plot
Students can create box plots for either built-in or user-specified data as well as experiment with outliers. User may choose to use or not use the median for calculation of interquartile range.
US Department of Education
National Center for Education Statistics: Create a Graph Tutorial
This tutorial walks students through how to create different types of graphs using the Create a Graph tool available on the website. Covers bar graphs, line graphs, pie charts, area graphs, scatter plots, and dependent and independent...
Annenberg Foundation
Annenberg Learner: Creating a Line Plot
Watch as a physical stack of coins is added as a series of dots to a line plot.
Khan Academy
Khan Academy: Graph Data on Line Plots
Record measurements on line plots (also called dot plots). Students receive immediate feedback and have the opportunity to try questions repeatedly, watch a video or receive hints.
Better Lesson
Better Lesson: Places Everyone. Analyzing and Creating Stem and Leaf Plots
The students will be using discovery techniques to learn about stem and leaf plots.
Khan Academy
Khan Academy: Interpret Dot Plots With Fractions 1
Create and interpret dot plots using data with fractions. Fraction operations include addition and subtraction. Students receive immediate feedback and have the opportunity to try questions repeatedly, watch a video or receive hints.
Khan Academy
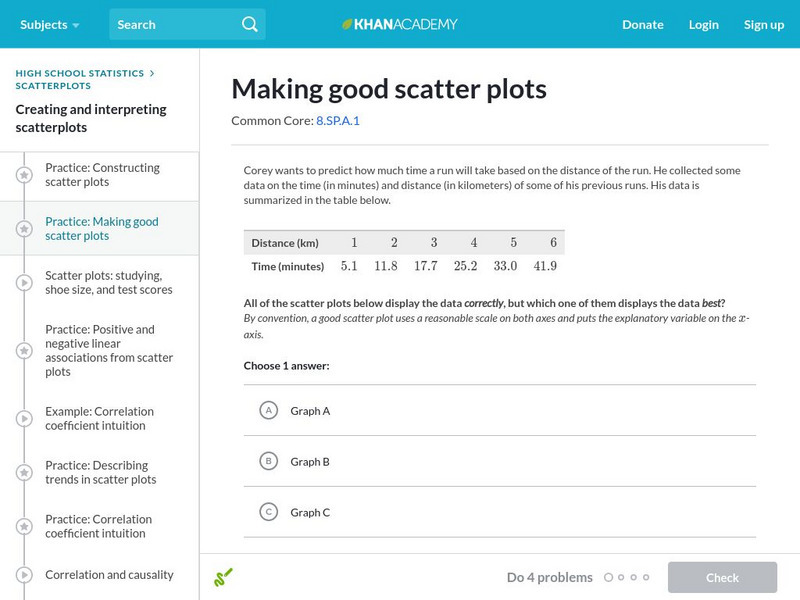
Khan Academy: Making Good Scatter Plots
A good scatter plot has the independent variable on the x-axis and the dependent variable on the y-axis. Also, the scale of both axes should be reasonable, making the data as easy to read as possible. In these practice problems, we...
Khan Academy
Khan Academy: Practice: Make Line Plots
A practice quiz where students construct line plots using the information given in the problems. Includes hints.
CK-12 Foundation
Ck 12: Applications of Box and Whisker Plots Grades 9 10
[Free Registration/Login may be required to access all resource tools.] Use calculators to create box-and-whisker plots.
Scholastic
Scholastic: Study Jams! Math: Data Analysis: Stem and Leaf Plots
Explore step by step how to organize and create stem and leaf plots. Then test your knowledge for understanding.


![National Security Agency: Line Plots: Frogs in Flight [Pdf] Lesson Plan National Security Agency: Line Plots: Frogs in Flight [Pdf] Lesson Plan](https://content.lessonplanet.com/knovation/original/122495-587001a487c71ef32e76fdab66ff794e.jpg?1661494304)


![Mr maffesoli.com: Line Plot Worksheet C [Pdf] Unknown Type Mr maffesoli.com: Line Plot Worksheet C [Pdf] Unknown Type](https://content.lessonplanet.com/knovation/original/120988-88ef11e71923fcc1040b64867e5e0c68.jpg?1661814823)


