College Board
AP® Psychology: Teaching Statistics and Research Methodology
Psychologists use statistics? Scholars investigate the research behind the methodology of statistical analysis. Using hands-on practice, case-studies, and scatterplots, they complete various tasks to understand the very roots of high...
New York State Education Department
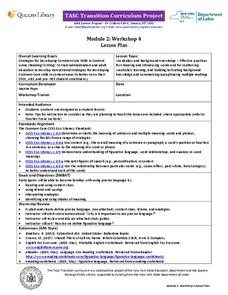
TASC Transition Curriculum: Workshop 4
Why is it important to use precise language? Participants explore this question in the fourth activity in a series of 15 on effective instruction. Perfect for all content areas, the activity promotes appropriate language choice through...
EngageNY
TASC Transition Curriculum: Workshop 15
What do a cheetah, Audi commercial, and air have in common? They're all topics of an engaging inquiry-based, hands-on workshop for educators about background knowledge, reading strategies, the CER model, and argumentative writing. The...
Missouri Department of Elementary
R-E-S-P-E-C-T: A Basic Skill
Imagine seventh graders developing a school wide plan to promote respect in their school. That's the vision behind the second instructional activity in the R-E-S-P-E-C-T series. In preparation for designing a school-wide media campaign,...
Texas Education Agency
Texas Gateway: Data, Sampling, and Variation in Data and Sampling
This learning module discusses quantitative and qualitative data, the use of two-way tables in marginal and conditional distributions, how to display data, variation in data and samples, and how to critically evaluate statistical...
Other
Dear Data
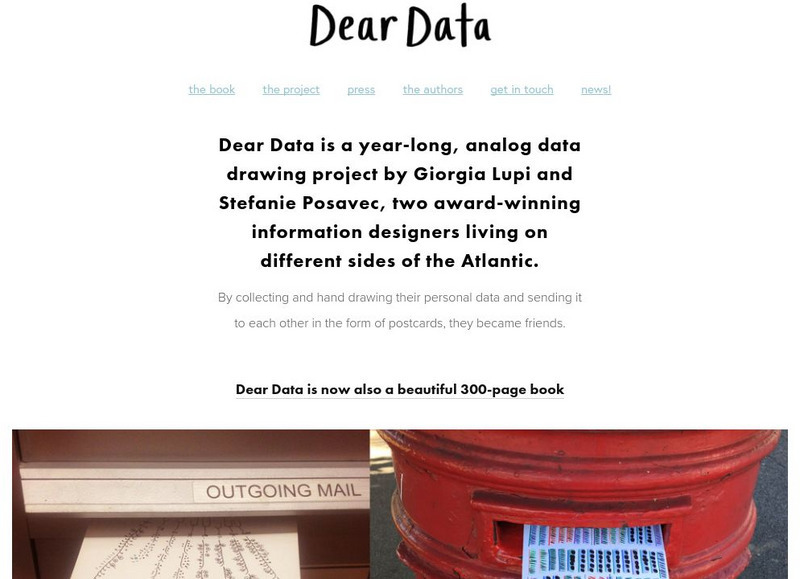
Dear Data is a year-long, analog data drawing project by Giorgia Lupi and Stefanie Posavec, two award-winning information designers living on different sides of the Atlantic. By collecting and hand drawing their personal data and sending...
Cuemath
Cuemath: Discrete Data
A comprehensive guide for learning all about discrete data with definitions, the difference between discrete and continuous data, graphical representation of discrete data through visualization, solved examples, and interactive questions...
PBS
Pbs Kids Afterschool Adventure!: Operation: Data Saves the Day Activity Plan
Data comes to the rescue! Children will collect, analyze, and represent data as they try to dodge a series of catastrophes faced by characters from their favorite PBS Kids shows.
Scholastic
Scholastic: Cultivating Data
Middle schoolers will understand key concepts of data analysis and their graphic representations. Students will construct and interpret data tables, line plots, box-and-whisker plots and stem-and-leaf plots, scatterplots with line of...
Texas Education Agency
Texas Gateway: Why Do We Need Data?
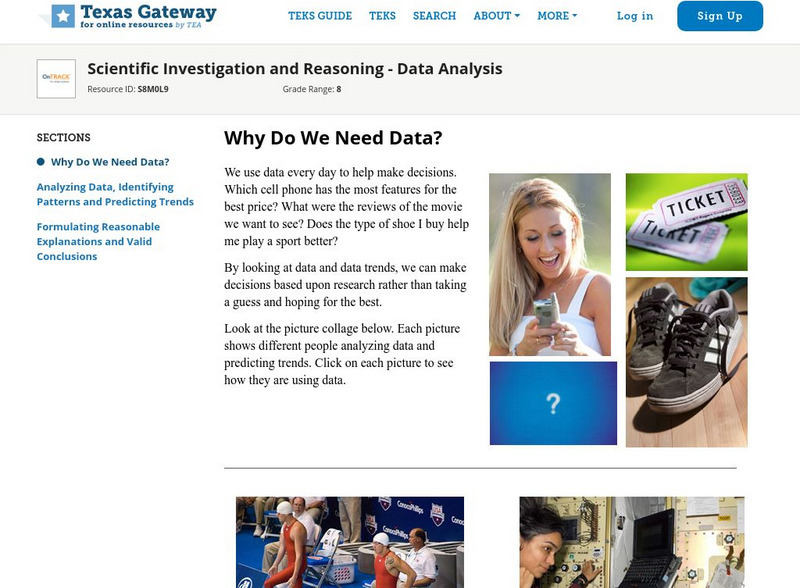
We use data every day to help make decisions. Which cell phone has the most features for the best price? What were the reviews of the movie we want to see? Does the type of shoe I buy help me play a sport better?By looking at data and...
REMC Association of Michigan
Remc Association of Michigan: 21 Things4 Students: 13. Dig the Data
This tutorial contains ten quests. You will learn to create spreadsheets and charts, use formulas, and make decisions based on data. The first five quests has students plan a party and in the last five, they collect and analyze data for...
BSCS Science Learning
Bscs: Asking and Answering Questions With Data
This inquiry is intended to provide students with practice developing investigable questions that need data, and specifically large datasets, to be answered. Click the teacher resources link for teaching guides and student handouts.
NASA
Nasa: Using Radiosonde Data From a Weather Balloon Launch
This lesson plan allows young scholars to learn about the layers of the atmosphere and to learn how to graph real atmospheric data.
National Council of Teachers of Mathematics
The Math Forum: Exploring Ocean Data Lesson Plan
Find "oceans of data" for students of all ages. NCTM, California, and Philadelphia standards are listed for each grade level along with lesson plans and other website resources.
Concord Consortium
Common Online Data Analysis Platform (Codap)
CODAP is a free, easy-to-use data analysis environment for students. Students can load their own data into an easy-to-use web-based data analysis tool to create their own datasets, share visualizations, and discover data-driven insights....
Center for Innovation in Engineering and Science Education, Stevens Institute of Technology
Ciese Real Time Data Projects: Weather Scope: A Study of Weather and Climate
Use real-time data to study factors that affect weather and climate, create weather instruments, and share data with students around the world.
Texas Education Agency
Texas Gateway: Quantitative vs. Qualitative Data
This lesson explores quantitative vs. qualitative scientific data.
Other
Ocean Tracks: Fact or Artifact? Interpreting Patterns in Ocean Tracks Data [Pdf]
Ever wonder where marine animals go? How fast they swim? How deep they dive? Electronic tagging has opened a new window into the world of the open ocean. Ocean Tracks gives you access to data collected by tags on real live migrating...
BBC
Bbc: Ks2 Bitesize: Interpreting Data Quiz
This site offers a 10 question, printable quiz on interpreting data. It also offers links to games and information about interpreting data.
The World Bank
World Bank: Data Catalog
This resource provides statistical data on numerous categories for nearly every country in the world. A great tool for a comparative analysis. Human, natural, and capital resources are all included.
Vision Learning
Visionlearning: Data: Data Analysis and Interpretation
An explanation of data from collection to analysis. Includes a discussion of how the same data may be interpreted various ways by different individuals.
Stanford University
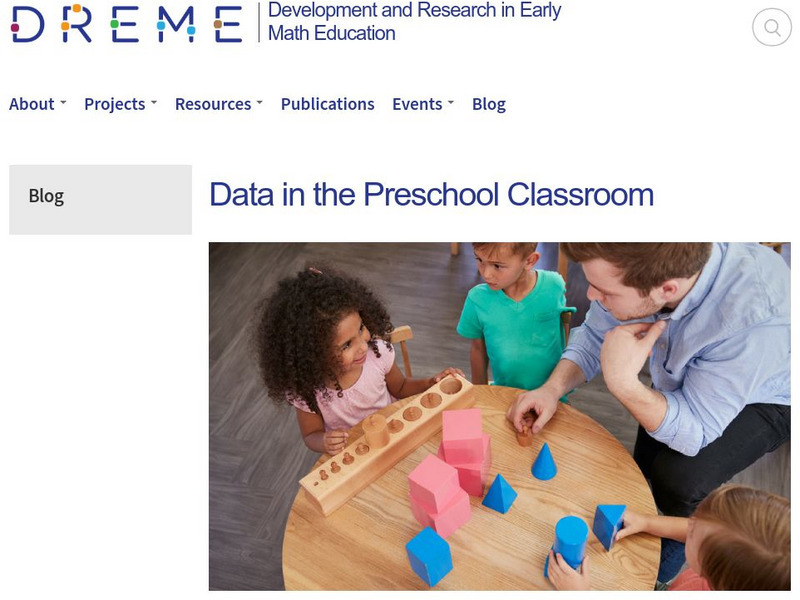
Dreme: Data in the Preschool Classroom
What are the important concepts involved in data collection and data use in the preschool classroom, and how can teachers support the mathematics of data? This article gives a brief description of the concepts that children need to grasp...
Vision Learning
Visionlearning: Data: Using Graphs and Visual Data in Science
An explanation of how data can be turned into visual forms which can help people comprehend information easier than observing numbers.
Science Buddies
Science Buddies: Interpreting Area Data From Maps vs. Graphs
Graphical methods of data presentation are a key feature of scientific communication. This project asks the question, "What's the best way to compare the land area of states: a map or a bar graph?" You'll be measuring performance on two...
Other popular searches
- Data, Census, & Statistics
- Data Analysis Pictograph
- Data Table
- Categorical Data
- Data Analysis Lesson Plans
- Data Management
- Data Analysis Graphing
- Data Analysis and Graphs
- Science Fair Project Data
- Data Display
- Organizing Data
- Census Data

