Hi, what do you want to do?
Cuemath
Cuemath: Scatter Plot
A comprehensive guide for learning all about scatter plots with definitions, how to construct and solve them, types of scatter plots, solved examples, and practice questions.
BSCS Science Learning
Bscs: Asking and Answering Questions With Data
This inquiry is intended to provide students with practice developing investigable questions that need data, and specifically large datasets, to be answered. Click the teacher resources link for teaching guides and student handouts.
PBS
Pbs Learning Media: Using Data Clusters to Find Hacker
The CyberSquad searches for Hacker's castle based on a survey of where town residents have last seen him in this video from Cyberchase.
CK-12 Foundation
Ck 12: Scatter Plots and Linear Correlation Grades 11 12
[Free Registration/Login may be required to access all resource tools.] This Concept introdices scatterplots and linear correlation for bivariate data.
University of South Florida
Florida Center for Instructional Tech: Famous People
Students estimate the ages of famous people, then create a scatterplot with the actual ages. This activity allows them to estimate with linear equations. You can access the age data through the "activity" link.
Texas Instruments
Texas Instruments: Math Today for Ti: Is Leisure Time Really Shrinking
Students will to organize data from the USA TODAY Snapshot, "Is leisure time really shrinking?," into two scatter plots and determine the quadratic model for each scatter plot. Students will determine if these graphs intersect and learn...
Alabama Learning Exchange
Alex: My Peanut Butter Is Better Than Yours!
This lesson plan provides a real-world example of using a scatter plot to compare data. It gives an assessment and ideas for remediation, extension as well as ways to manage behavior problems and reluctant learners.
Scholastic
Scholastic: Shake, Rattle & Roll
Students will learn and reinforce skills for creating and analyzing scatterplots and histograms; using cost-benefit analysis to make predictions from data and using tree diagrams to understand outcomes of events.
Texas Instruments
Texas Instruments: Math Today More of Us
In this activity students will investigate exponential functions and their graphs using real-life data. Students will analyze population data for the United States and create an exponential model for the scatter plot.
BSCS Science Learning
Bscs: Global Night Sky Comparison
This inquiry invites students to investigate human impacts on the environment. Specifically, students will examine the relationship between human population, light pollution, and how brightly celestial objects like stars appear in the...
Texas Instruments
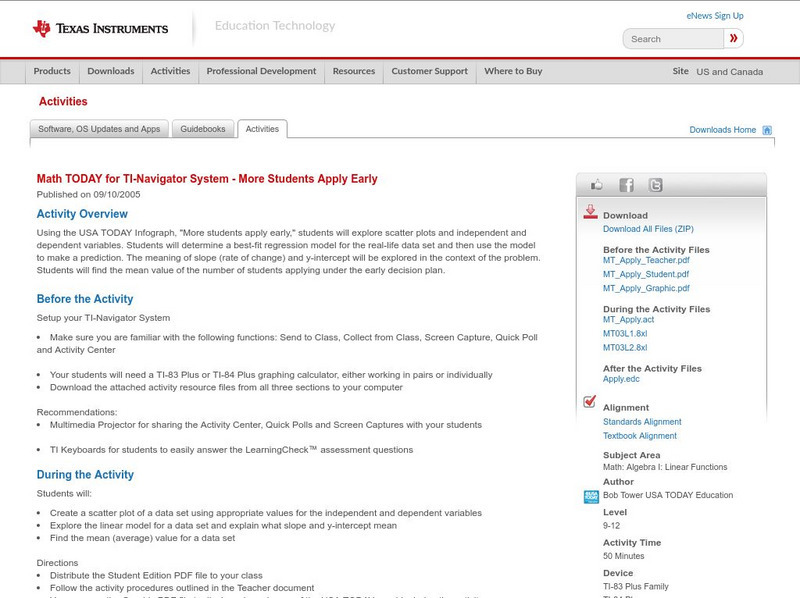
Texas Instruments: Math Today for Ti Navigator System: More Students Apply Early
Using the USA TODAY Infograph, "More students apply early," students will explore scatter plots and independent and dependent variables. Students will determine a best-fit regression model for the real-life data set and then use the...
York University
York Univ.: Statistical Graphics for Multivariate Data
Provides several graphical representations of multivariate data. This paper explains the graphs such as the scatter plot and several other graphs as well. Site is presented in notes and outline format.
Illustrative Mathematics
Illustrative Mathematics: 8.sp.1 Texting and Grades I
This task looks at a possible relationship between how many text messages high school students send and their grade point average. The data is presented in a scatter plot which students must examine for patterns and deviations. Aligns...
BSCS Science Learning
Bscs: Budburst Lilac Festival
In this Inquiry, students predict the best date to host a lilac blossom festival so that lilacs are in full bloom in the city where students live. Students are introduced to Project Budburst, a citizen science project in which volunteers...
Illustrative Mathematics
Illustrative Mathematics: 8.sp Birds' Eggs
A scatter plot showing data for the sizes of birds' eggs is presented. Students are to look for correlations and make predictions whose values fall within the data range. They are also to make generalizations about the characteristics of...
Texas Education Agency
Texas Gateway: Analyzing Scatterplots
Given a set of data, the student will be able to generate a scatterplot, determine whether the data are linear or non-linear, describe an association between the two variables, and use a trend line to make predictions for data with a...
Texas Education Agency
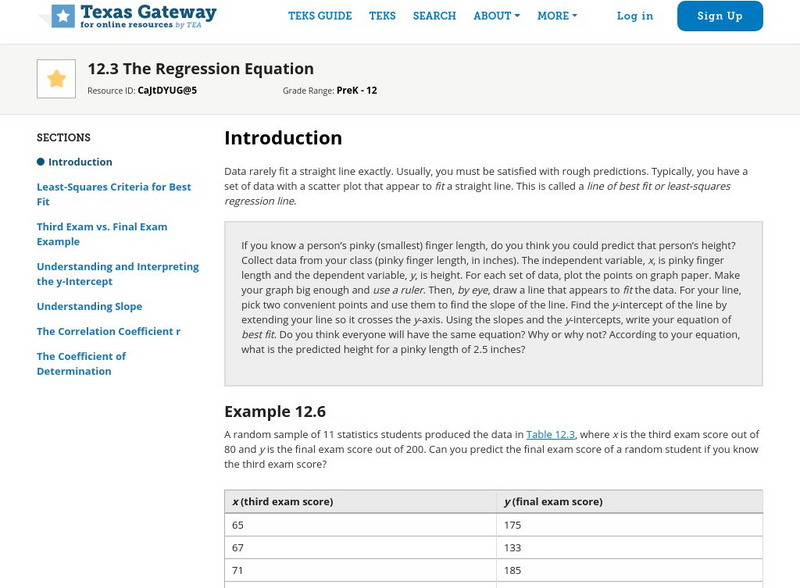
Texas Gateway: Tea Statistics: The Regression Equation
A tutorial on how to find the line of best fit or least-squares regression line for a set of data in a scatter plot using different methods and calculations.
Shodor Education Foundation
Shodor Interactivate: Lesson: Stem and Leaf Plots
Lesson plan introduces students to stem-and-leaf plots. Many resources are available for student and teachers here.
Texas Instruments
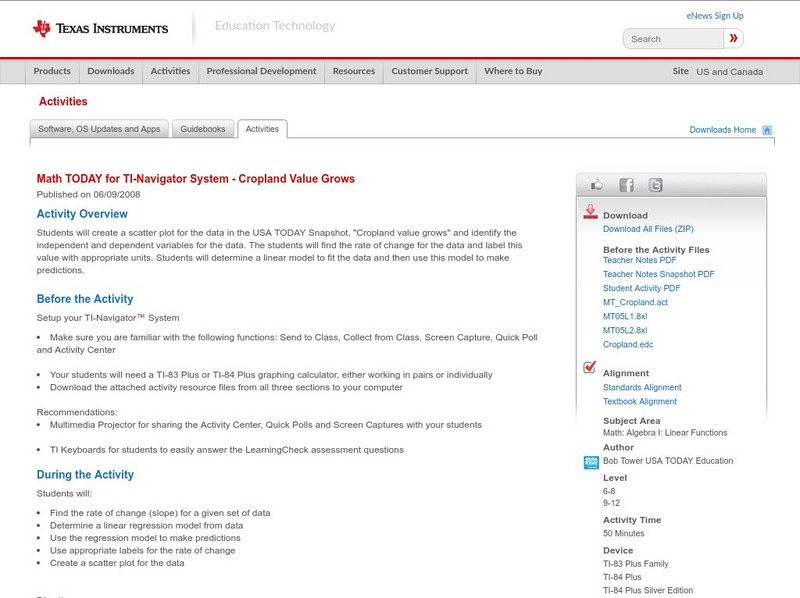
Texas Instruments: Math Today for Ti Navigator System Cropland Value Grows
Students will create a scatter plot for the data in the USA TODAY Snapshot, "Cropland value grows," and identify the independent and dependent variables for the data. The students will find the rate of change for the data and label this...
PBS
Pbs Teachers: Sports and Math: Will Women Athletes Ever Catch and Surpass
Explore, explain and make conclusions based on graphs of scatter plots of the Olympic records for men and women in the same event over the same years. Plot x- and y-values, and create linear equations from the data.
Khan Academy
Khan Academy: Scatterplots and Correlation Review
A scatterplot is a type of data display that shows the relationship between two numerical variables. Each member of the dataset gets plotted as a point whose x-y coordinates relates to its values for the two variables.
Cuemath
Cuemath: Line Graphs
A comprehensive guide for learning all about line graphs with definitions, their sections, how to read and create graphs, solved examples, and practice questions.
Illustrative Mathematics
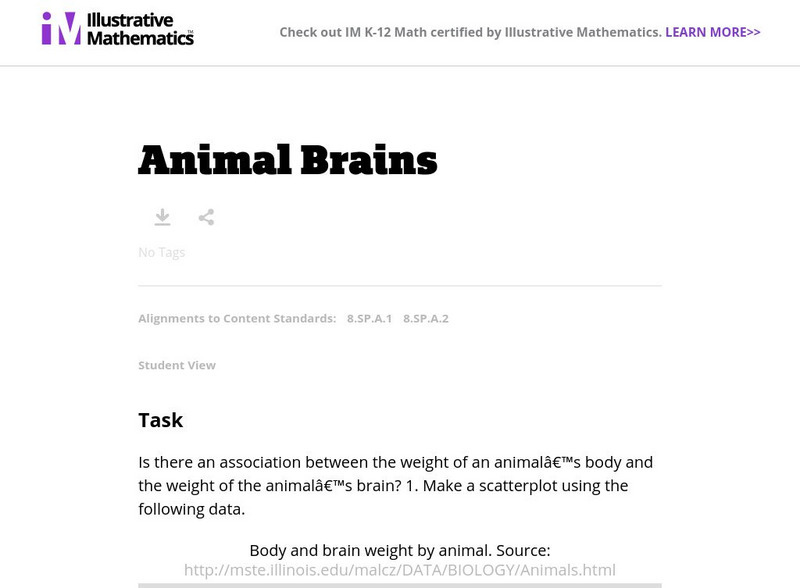
Illustrative Mathematics: 8.sp Animal Brains
This task looks at a possible relationship between the weight of an animal's body and the weight of its brain. Students make a scatter plot of data, look for outliers, make a second scatter plot without the outliers, and describe the...
Texas Instruments
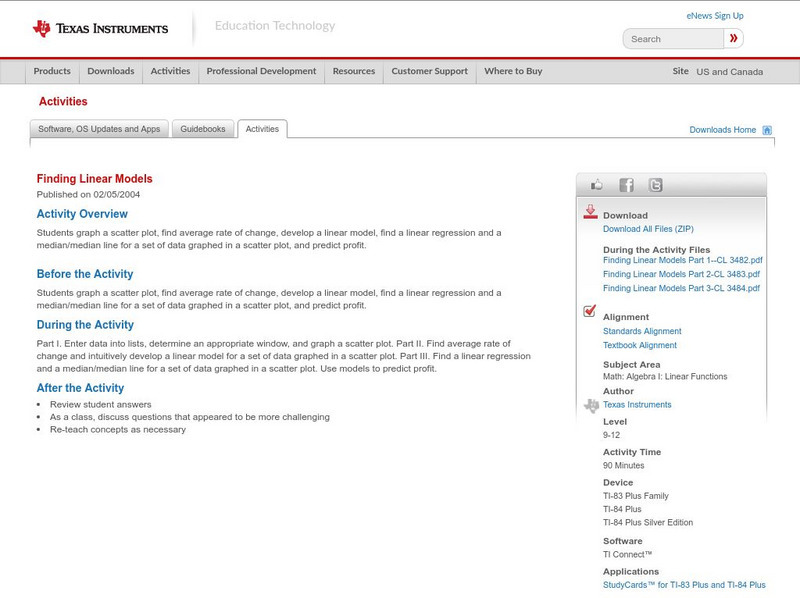
Texas Instruments: Finding Linear Models
Students graph a scatter plot, find average rate of change, develop a linear model, find a linear regression and a median/median line for a set of data graphed in a scatter plot and predict profit.


