Hi, what do you want to do?
Beacon Learning Center
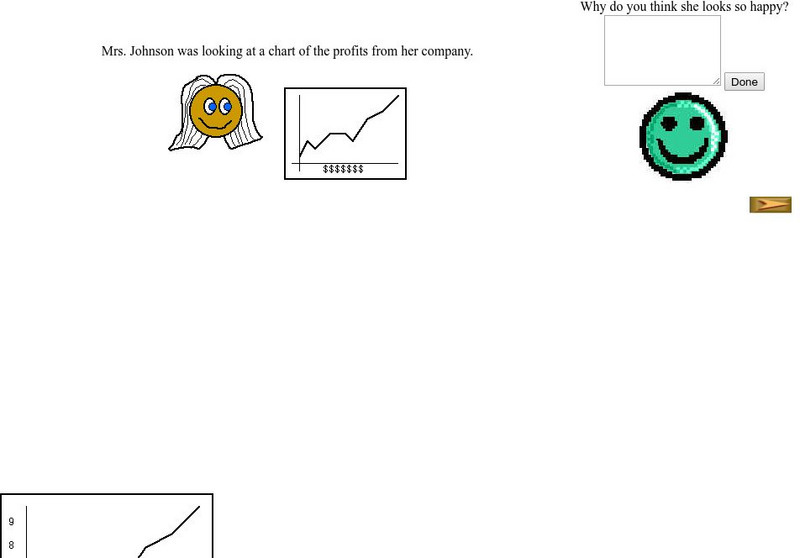
Beacon Learning Center: Interpreting Line Graphs
This site is a lesson on creating and interpreting a line graph. It explains how a line graph is created and then asks questions about what is learned from the data. Students type in open responses, and answers and feedback follow.
E-learning for Kids
E Learning for Kids: Math: Elephant Plant: Data and Graphs
On this interactive website students practice various math skills using a real-life scenario involving plants. Those skills include interpreting data in a circle graph, interpreting data in a divided bar graph, and interpreting a bar...
Oswego City School District
Regents Exam Prep Center: Practice With Organizing and Interpreting Data
Several problems are presented to test your skills in creating and interpreting frequency tables, pie charts, box-and-whisker and stem-and-leaf plots.
Khan Academy
Khan Academy: Calculating the Median: Data Displays
Practice computing the median of data sets presented in a variety of formats, such as frequency tables and dot plots. Students receive immediate feedback and have the opportunity to try questions repeatedly, watch a video or receive hints.
Other
Delta State University: Lesson Plan 3: Pie Graphs
The students will gather, organize, and display data in an appropriate pie (circle) graph using M&M's! [PDF]
Math Is Fun
Math Is Fun: Data Graphs
Create and customize a bar graph, line graph, or pie chart based on a set of data and print it out.
Math Is Fun
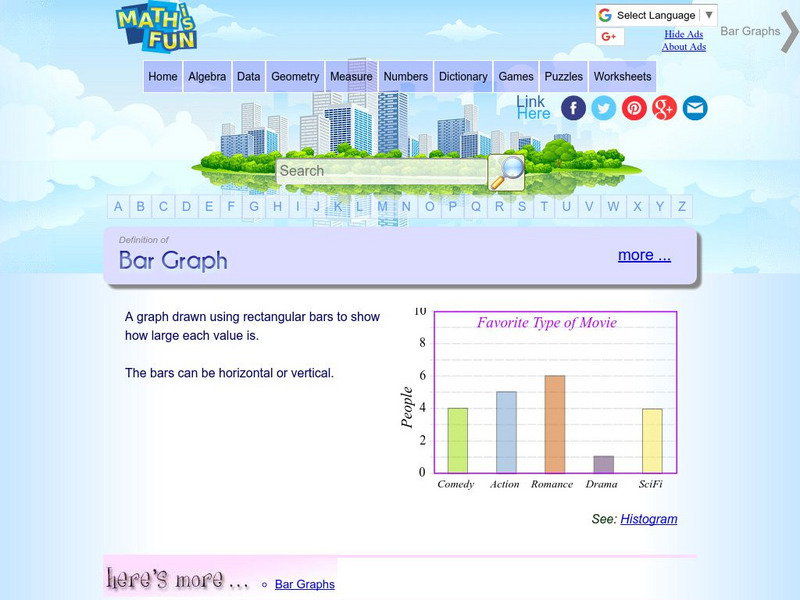
Math Is Fun: Definition of Bar Graph
Get the definition for a bar graph. Then, select the link "here's more" and use the interactive graph to display data as a bar graph, line graph or pie chart. The finished graph may be printed.
University of Cambridge
University of Cambridge: Maths and Sports: Charting Success
Sports statisticians, trainers and competitors create graphs, charts and diagrams to help them to analyse performance, inform training programmes or improve motivation. This activity encourages students to consider and analyse...
University of Cambridge
University of Cambridge: Maths and Sports: Match the Matches
Decide which charts and graphs represent the number of goals two football teams scored in fifteen matches. This data handling activity is designed to get children talking meaningfully about mathematics, presenting and justifying...
E-learning for Kids
E Learning for Kids: Math: Tea Store: Reading a Table
Students will demonstrate how to interpret information in a table.
PBS
Pbs Learning Media: Graphs, Charts, and Tables: Targeted Math Instruction
At the end of this lesson about graphs, charts, and tables, students will be able to interpret and compare data from graphs (including circle, bar, and line graphs), charts, and tables.
E-learning for Kids
E Learning for Kids: Math: Group of Pyramids: Fractions and Graphs
On this interactive website, students practice various math skills using a real-life scenario at the pyramids. Those skills include showing percentages as fractions and decimals and interpreting data in a sector graph.
University of Regina (Canada)
University of Regina: Math Central: Performance Stations in Math: Grade 6
The Saskatoon Board of Education provides teachers with this collection of grade six math performance stations. Although several of the stations have been designed as assessment tools for the Saskatchewan curriculum, teachers may also...
University of Regina (Canada)
University of Regina: Math Central: Performance Stations in Math: Grade 7
The Saskatoon Board of Education provides teachers with this collection of grade seven math performance stations. Although several of the stations have been designed as assessment tools for the Saskatchewan curriculum, teachers may also...
University of Regina (Canada)
University of Regina: Math Central: Performance Stations in Math: Grade 8
The Saskatoon Board of Education provides teachers with this collection of grade eight math performance stations. Although several of the stations have been designed as assessment tools for the Saskatchewan curriculum, teachers may also...
University of Regina (Canada)
University of Regina: Math Central: Performance Stations in Math: Grade 9
The Saskatoon Board of Education provides teachers with this collection of grade nine math performance stations. Although several of the stations have been designed as assessment tools for the Saskatchewan curriculum, teachers may also...
PBS
Pbs: Mathline Creature Feature Lesson Plan [Pdf]
An interdisciplinary math, science, and language arts lesson that engages students in an exploration of statistics. Through a study of various forest climates, students utilize data collection and analysis, classification, and graphing....
Khan Academy
Khan Academy: Comparing Data Displays
Practice interpreting and comparing dot plots, histograms, and box plots. Students receive immediate feedback and have the opportunity to try questions repeatedly, watch a video or receive hints.
Khan Academy
Khan Academy: Interpreting Quartiles
Practice understanding the meaning of quartiles of data sets. Students receive immediate feedback and have the opportunity to try questions repeatedly, watch a video or receive hints.
Scholastic
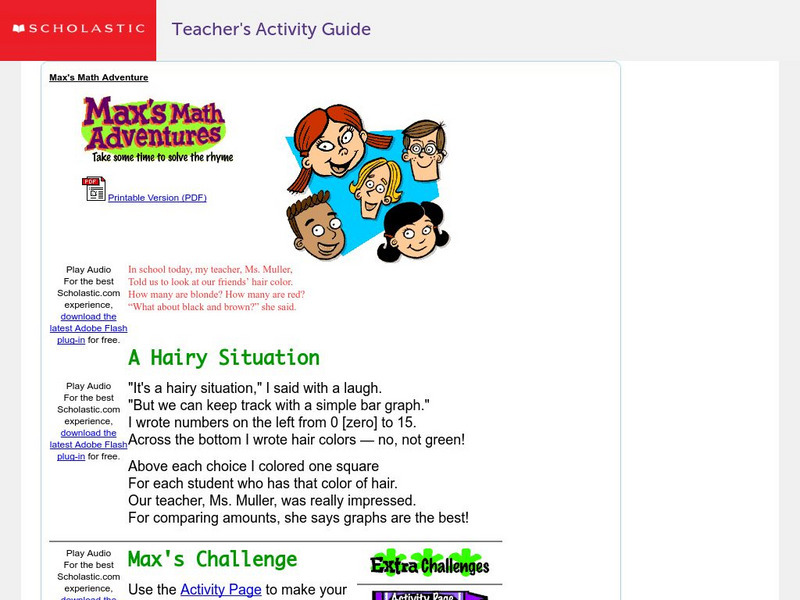
Scholastic: Max's Math Adventures: A Hairy Situation
Help Max make a bar graph to show the hair colors of his classmates. Teachers will appreciate the activities with bar graphs in the extra challenges. Use the teacher's guide to create a fun and engaging lesson.
The Math League
The Math League: Ratio and Proportion
This tutorial provides definitions and examples of ratios and proportions and features comparing ratios and converting rates.
Texas A&M University
Wtamu Virtual Math Lab: Beginning Algebra: Reading Graphs
A good introduction to reading bar, line, and double line graphs, and drawing and reading Venn diagrams. Contains definitions and examples of these types of charts and graphs as well as practice exercises that ask you to answer questions...
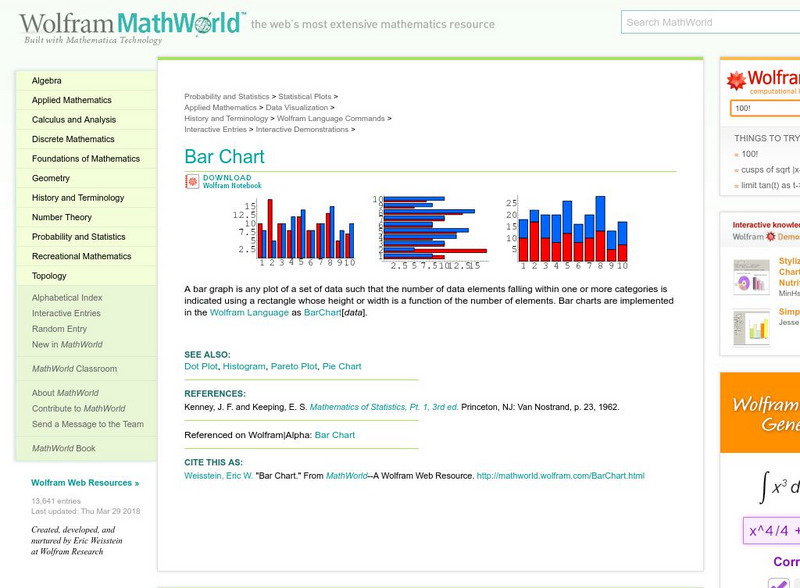
Wolfram Research
Wolfram Math World: Bar Chart
MathWorld offers a definition and example of the math term, "bar chart."
The Math League
The Math League: Using Data and Statistics: Pie Charts
This introductory tutorial about statistical graphing with four examples of how pie charts (circle graphs) are constructed and read.


