Hi, what do you want to do?
Scholastic
Scholastic: Cultivating Data
Students will understand key concepts of data analysis and their graphic representations. Students will construct and interpret data tables, line plots, box-and-whisker plots and stem-and-leaf plots, scatterplots with line of best fit,...
Center for Innovation in Engineering and Science Education, Stevens Institute of Technology
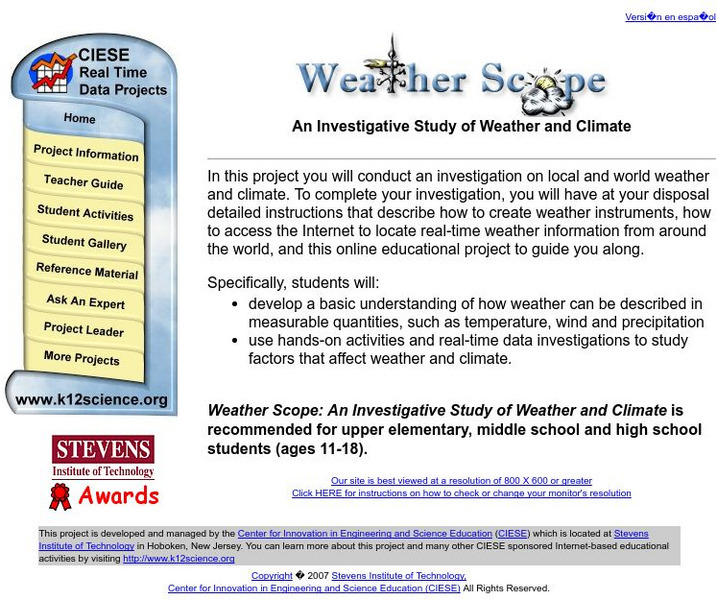
Ciese Real Time Data Projects: Weather Scope: A Study of Weather and Climate
Use real-time data to study factors that affect weather and climate, create weather instruments, and share data with students around the world.
Other
Nearpod: Displaying Data: Dot Plots
In this lesson, students will learn how to create and intrepret dot plots.
Other
Nearpod: Displaying Data: Box Plots
In this lesson, students will learn how to create and intrepret box plots using the 5-number summary.
Shodor Education Foundation
Shodor Interactivate: Comparison of Univariate and Bivariate Data
Young scholars learn about the difference between univariate and bivariate data and understand how to choose the best graph to display the data.
Texas Instruments
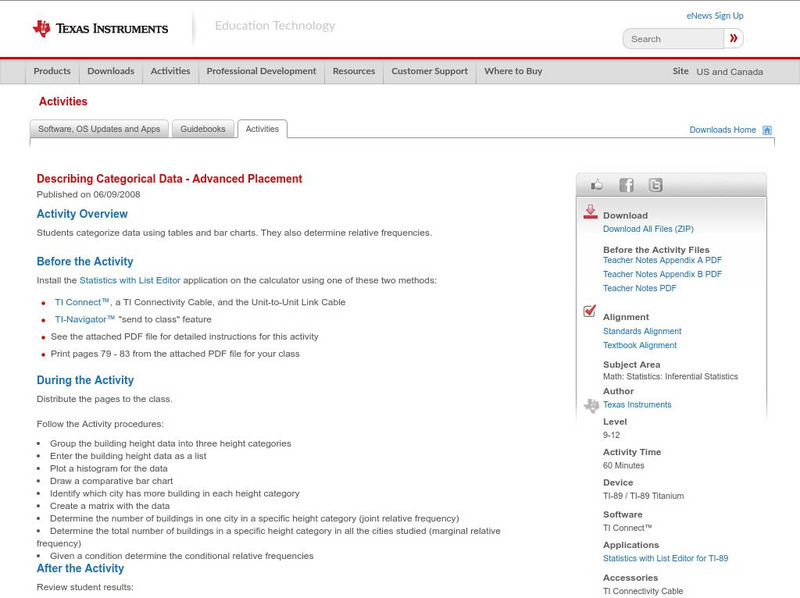
Texas Instruments: Describing Categorical Data Advanced Placement
Students categorize data using tables and bar charts. They also determine relative frequencies.
National Council of Teachers of Mathematics
The Math Forum: Seventh Grade Mathematics: Data Sense
This site has some interesting ways to collect and evaluate data. There are some activities about note taking, spreadsheets, surveys, and a cool bridge construction project. Teachers may want to use this site as a resource for some...
PBS
Pbs Learning Media: Graphs, Charts, and Tables: Targeted Math Instruction
At the end of this lesson about graphs, charts, and tables, students will be able to interpret and compare data from graphs (including circle, bar, and line graphs), charts, and tables.
Better Lesson
Better Lesson: Reading Tables: What Breakfast Food Is Your Favorite?
In this lesson, 2nd graders will understand that tables help us organize information clearly.
Better Lesson
Better Lesson: Building and Reading Tables With Three Digit Numbers
Second graders gain fluency in reading and building tables using three-digit numbers. This lesson plan includes a detailed plan, printable worksheets, a video showing students engaged in the lesson plan, and an exit ticket to assess...
University of Texas
Inside Mathematics: Our Pets [Pdf]
This task challenges a student to demonstrate understanding of concepts involved in representing and interpreting data.
University of Texas
Inside Mathematics: Parking Cars [Pdf]
This task challenges a student to use their understanding of scale to read and interpret data in a bar graph.
Other
The Actuarial Foundation: Play Ball! [Pdf]
Young scholars will understand and apply concepts of data collection, representation, and analysis in a sports context.
Google
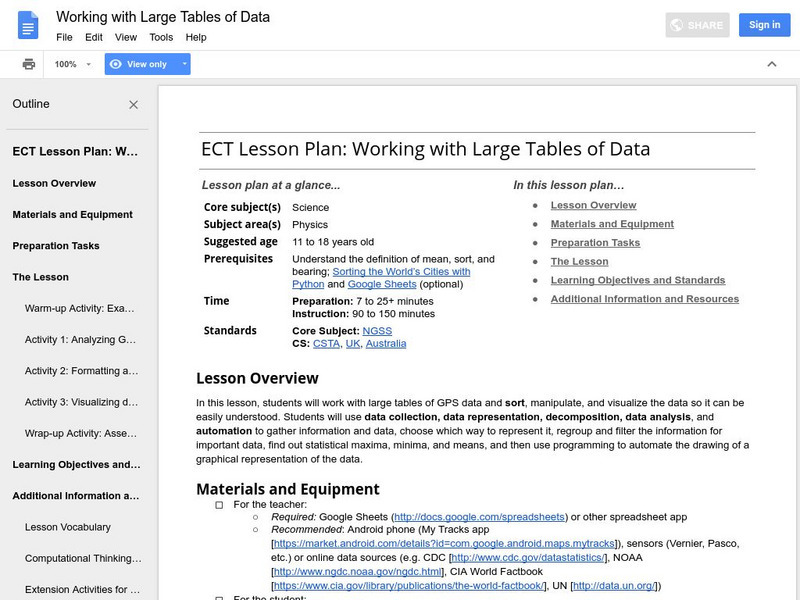
Google for Education: Working With Large Tables of Data
Students work with large tables of GPS data and sort, manipulate, and visualize the data so it can be easily understood.
Google
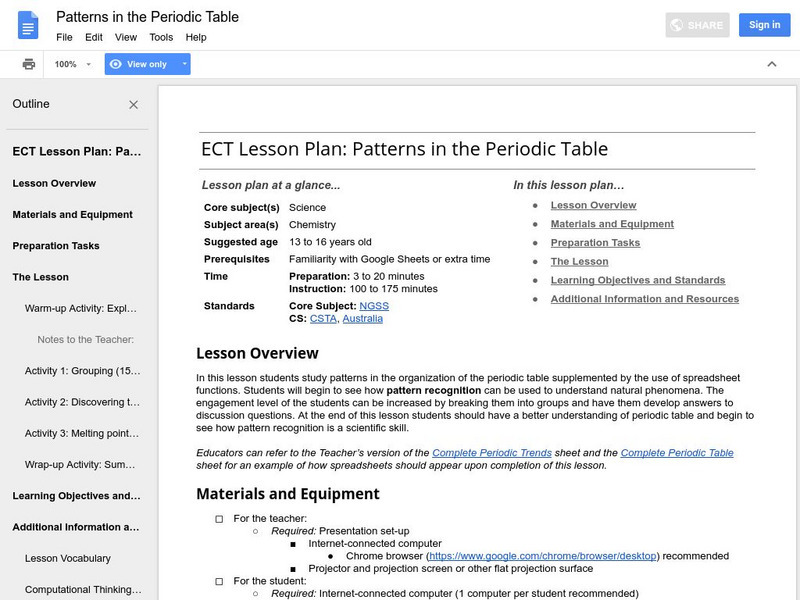
Google for Education: Patterns in the Periodic Table
Students study trends in the periodic table of elements, supplemented by the use of spreadsheet functions. The spreadsheet functions presented can be used on any data set.
Better Lesson
Better Lesson: Making a Table
First graders get a chance to use tables when breaking a total quantity into its component parts.
Better Lesson
Better Lesson: Graphing Using a Frequency Table
Multiple graphs can represent the same data set and make the information easier to understand.
Better Lesson
Better Lesson: Class Surveys and Graphs
Students love graphing data that they "own". For this plan, the class will select a type of graph and create it using a class survey frequency table. Included in this lesson are videos of the class engaged in the lesson and samples of...
Utah Education Network
Uen: 1st Grade Act. 03: T Shirt Glyph
During this mini-unit, students will develop a t-shirt with a glyph that represents their own personalities. Then students will read the glyphs of others using a legend to understand the data on the glyphs.
Science Education Resource Center at Carleton College
Serc: Mn Step: Statistical Analysis of Lincoln
For this activity, students first work in groups to collect information about a set of pennies. They measure and record the mass for each one in a table using a spreadsheet program if possible. They also record its year and, for 1982...
Alabama Learning Exchange
Alex: Who Wants to Know the Periodic Table?
The purpose of the project is to help the students gain an in depth knowledge of the Periodic Table of Elements. The periodic table is the very backbone of chemistry. In order for the students to be successful in chemistry, they must be...
Alabama Learning Exchange
Alex: Great Golly Graphs
This lesson plan asks middle schoolers to create a survey project including graphs, questions, tables, and data analysis. It gives an assessment and ideas for remediation and extension as well as ways to manage behavior problems and...
CPALMS
Cpalms: Dollars for Density
This is a guided inquiry activity in which students use simple lab procedures and discussions to develop and apply the concept of density. Students collect and graph data which they use to explore the relationship between mass and...
University of Texas
Inside Mathematics: Granny's Balloon Trip [Pdf]
This task challenges a student to use knowledge of scale to organize and represent data from a table on a graph.
Other popular searches
- Creating Data Tables
- Science Data Tables
- Making Data Tables
- Organizing Data in Tables
- Data Tables and Graphing
- Graphs and Data Tables
- Data Tables and Charts
- Create Data Tables From Graphs
- Data Tables Lesson Plans
- Data Tables Surveys
- Pocket Data Tables
- Using Data Displays


