Hi, what do you want to do?
Louisiana Department of Education
Louisiana Doe: Louisiana Believes: Eureka Math Parent Guide: Collecting and Displaying Data
A guide to support parents as they work with their students in collecting and displaying data.
Texas Instruments
Texas Instruments: Mc Dougal Littell Middle School Math: Making Data Displays
Students will create data displays using a scatter plot and a line graph of the data and a circle graph of survey data.
PBS
Pbs Learning Media: Using Data Clusters to Find Hacker
The CyberSquad searches for Hacker's castle based on a survey of where town residents have last seen him in this video from Cyberchase.
Better Lesson
Better Lesson: Class Surveys and Graphs
Students love graphing data that they "own". For this plan, the class will select a type of graph and create it using a class survey frequency table. Included in this lesson are videos of the class engaged in the lesson and samples of...
Better Lesson
Better Lesson: Fast Food Freddie Surveys and Bar Graphs
Students continue to build their graphing skills. They experience a real world application of graphing by organizing survey results.
National Council of Teachers of Mathematics
The Math Forum: Seventh Grade Mathematics: Data Sense
This site has some interesting ways to collect and evaluate data. There are some activities about note taking, spreadsheets, surveys, and a cool bridge construction project. Teachers may want to use this site as a resource for some...
CK-12 Foundation
Ck 12: Statistics: Data Display Choices Grades 6 7
[Free Registration/Login may be required to access all resource tools.] Create surveys and display data using different types of graphs.
Math Is Fun
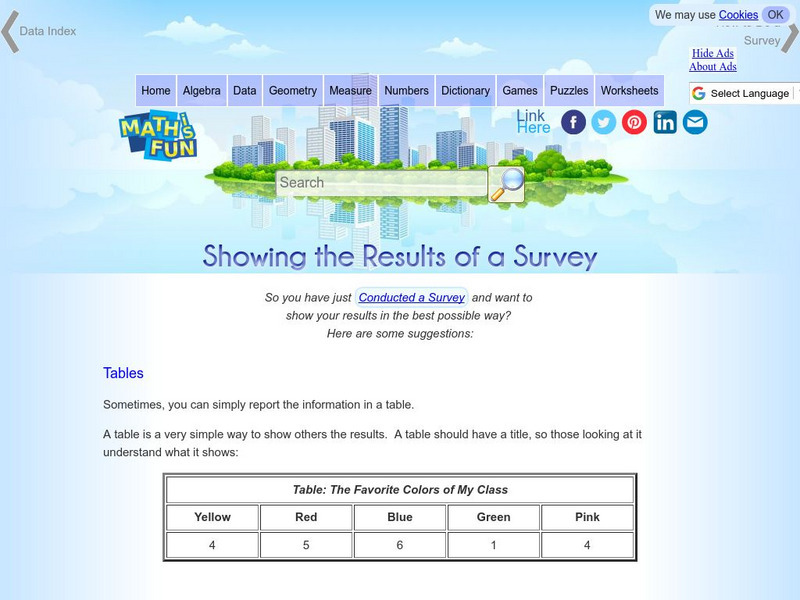
Math Is Fun: Showing the Results of a Survey
A variety of ways to display the results of a survey are listed, including tables, statistics and different types of graphs.
Better Lesson
Better Lesson: Reading Tables: What Breakfast Food Is Your Favorite?
In this lesson, 2nd graders will understand that tables help us organize information clearly.
Alabama Learning Exchange
Alex: Ice Cream Sundae Survey
Students quickly realize the importance of learning how to read and find information in charts, graphs, and tables compared to finding the same information written in a paragraph. This is a fun, high energy lesson!This lesson plan was...
E-learning for Kids
E Learning for Kids: Math: Tea Store: Reading a Table
Students will demonstrate how to interpret information in a table.
US Department of Labor
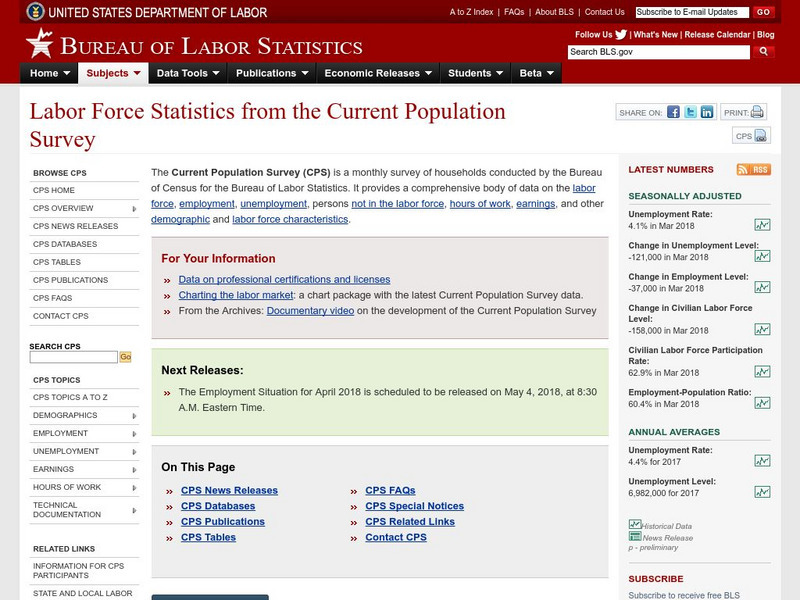
Bureau of Labor Statistics:labor Force Statistics From Current Population Survey
The Current Population Survey (CPS) is a monthly survey of households conducted by the Bureau of Census for the Bureau of Labor Statistics. It provides a comprehensive body of data on the labor force, employment, unemployment, and...
US Census Bureau
United States Census Bureau: Population Projections Tables
Series of projections for different years.
Alabama Learning Exchange
Alex: Great Golly Graphs
This lesson plan asks middle schoolers to create a survey project including graphs, questions, tables, and data analysis. It gives an assessment and ideas for remediation and extension as well as ways to manage behavior problems and...
Alabama Learning Exchange
Alex: Getting to Know Your Classmates Using Bar Graphs
Students will collect data from class using surveys. Students survey classmates concerning favorite movies, favorite color, shoe size, time spent studying, brand of cell phone and etc. From the data they will create bar graphs using an...
Rice University
Rice University: The Hand Squeeze
Students will enjoy this data collection and class analysis experiment involving the time it takes for a hand squeeze to travel around a circle of people. From organizing the activity to collecting the data to making a table and graphing...
Other
Laus Dnet: Grade 5 Excel Lesson Plan
In this online lesson, students will survey students in their school to determine their favorite type of hand-held ice cream. Before performing the survey, students will make predictions about which ice creams they think will be the...
US Geological Survey
Bismuth
A listing of all sorts of available reports on bismuth. Great resources for students at many levels.
Tom Richey
Linked in Learning: Inherited Traits
Use this slideshow to teach your class the difference between inherited and learned traits. Includes a survey of traits, a data table, a chart with examples of inherited traits, and questions to spur engagement and discussion.
US Census Bureau
U.s. Census Bureau: Population and Housing Unit Estimates
This site is prepared by the U.S. Census Bureau and has numerous links to topics such as national, state, and county estimates, and much more. Estimates are also available for previous years.


