Google
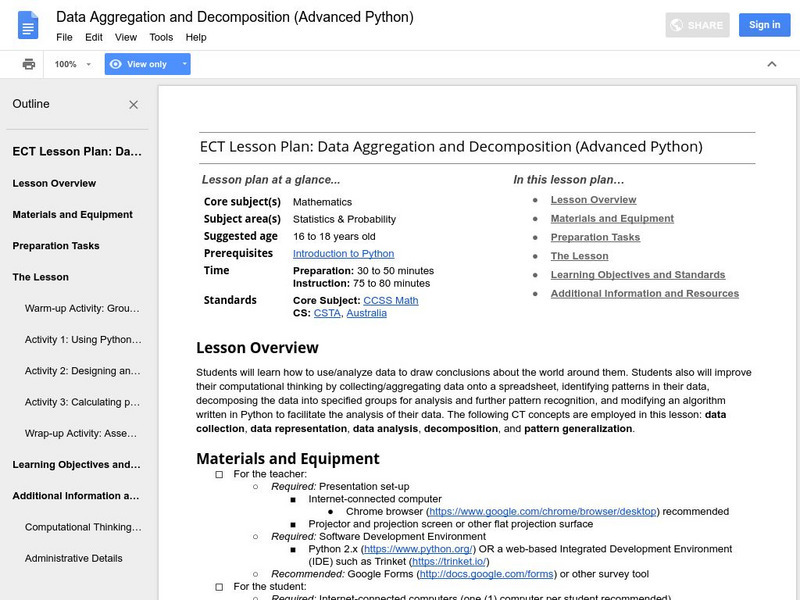
Google for Education: Data Aggregation and Decomposition (Python)
Students learn how to use and analyze data to draw conclusions about information collected from classmates. Then they use computational thinking by collecting and aggregating data onto a spreadsheet, identifying patterns in their data,...
Texas Instruments
Texas Instruments: Gemini Candy
In this activity, students work in groups to collect data and draw conclusions from random samples simulated by drawing tiles from a bag. They represent the data collected in the form of a triple bar graph.
Center for Innovation in Engineering and Science Education, Stevens Institute of Technology
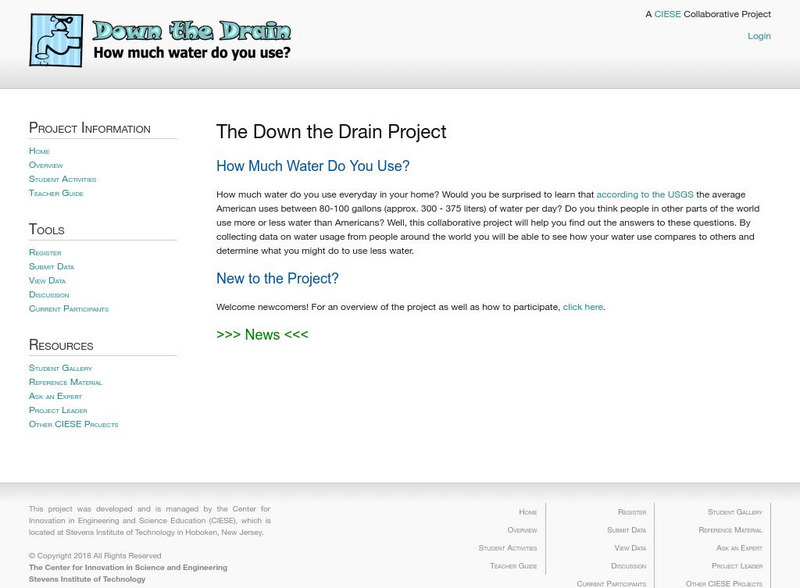
Ciese: Down the Drain Project
Teachers can start this project at any time and no registration is required. Students collect data about water usage for themselves, their homes and their class. They analyze it, make predictions about it, and submit the data to the...
Science Education Resource Center at Carleton College
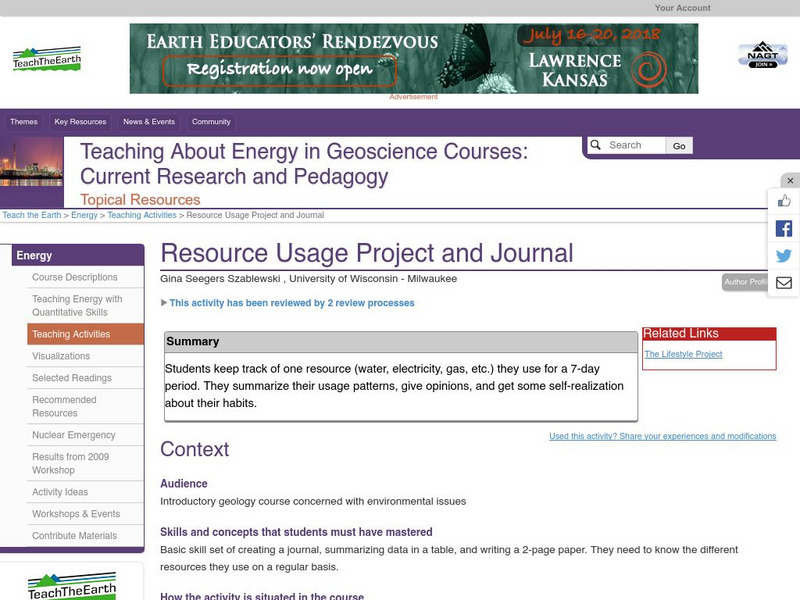
Serc: Resource Usage Project and Journal
Learners pick a resource and track their use of it over the course of one week. Students record their data in a spreadsheet, write a summary of it, and draw conclusions from their usage patterns. A detailed student handout is provided.
Khan Academy
Khan Academy: Valid Claims
Practice figuring out whether we took a random sample and whether we're able to draw valid conclusions from our data. Students receive immediate feedback and have the opportunity to try questions repeatedly, watch a video or receive hints.
Physics World
Physics World: Contextual Physics in Ocean Park
After downloading the "Motion Video Analysis" software, users can collect data about moving object's position from digital movie clips. This collection of data will allow them to plot motion graphs and draw conclusions about physics in...


