Hi, what do you want to do?
CK-12 Foundation
Ck 12: Function Rules for Input Output Tables: Soda Sugar Function Table
[Free Registration/Login Required] Students are given an input/output table and are to determine the inputs and write rules for the function. Click 'Challenge Me' to answer practice questions and click 'Learn More' for more information...
Khan Academy
Khan Academy: Algebra I: Exponential Functions From Tables & Graphs
Write exponential functions of the basic form f(x)=a * b squared, either when given a table with two input-output pairs, or when given the graph of the function. Students receive immediate feedback and have the opportunity to try...
CK-12 Foundation
Ck 12: Algebra: Graphs of Linear Equations
[Free Registration/Login may be required to access all resource tools.] Students learn to use a table to graph functions recognizing linear equations and the equations of horizontal lines and vertical lines. Students examine guided...
Texas Education Agency
Texas Gateway: Direct Variation and Proportional Change
The student will use a variety of methods inculding tables, equations and graphs to find the constant of variation and missing values when given a relationship that varies directly.
Khan Academy
Khan: Lsn 8: Interpreting Relationships in Scatterplots/graphs/tables/equations
This lesson focuses on Interpreting and analyzing linear, quadratic, and exponential models and graphs. Students will use best fit lines to interpret contexts, distinguish whether contexts are linear or exponential functions, use the...
Texas Instruments
Texas Instruments: From Tables to Graphs
Students learn how to generate a table of values showing the accumulated amounts of a sum of money compounded over n periods. They graph these values and learn how to determine the accumulated amount corresponding to any given period.
University of Texas at Austin
Mathematics Teks Toolkit: Making Connections
In this lesson, students will use input/output tables to explore functions, equations, and graphs.
Other
Nearpod: Graphing Equations Using a Table
In this lesson on graphing equations using a table, students will learn how to create a table for a function in terms of domain and range and then graph the function on the coordinate plane.
Texas Instruments
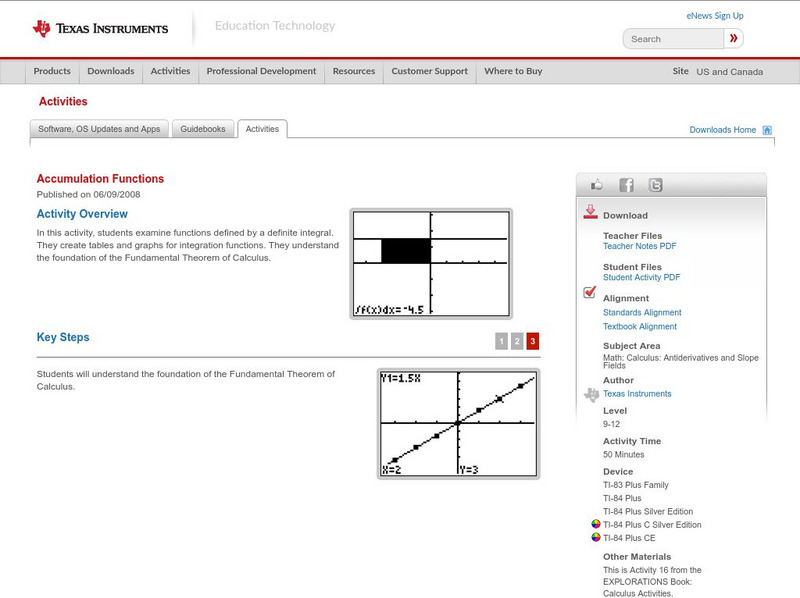
Texas Instruments: Accumulation Functions
In this activity, students examine functions defined by a definite integral. They create tables and graphs for integration functions. They understand the foundation of the Fundamental Theorem of Calculus.
Texas Education Agency
Texas Gateway: Connecting Multiple Representations of Functions
The student will consider multiple representations of linear functions, including tables, mapping diagrams, graphs, and verbal descriptions.
Texas Education Agency
Texas Gateway: Functions and Their Inverses
Given a functional relationship in a variety of representations (table, graph, mapping diagram, equation, or verbal form), the student will determine the inverse of the function.
Khan Academy
Khan Academy: Recognize Functions From Tables
Determine whether a table of values of a relationship represents a function. Students receive immediate feedback and have the opportunity to try questions repeatedly, watch a video or receive hints.
Other
Limits a Geometric and Numeric Approach
Students learn about limits using geometric and numeric approaches. Topics include limits using tables and limits with graphs. The resource consists of graphs, examples, and a learning game.
PBS
Pbs: Comparing Exponential, Quadratic, and Linear Functions
Analyze the numerical and graphical representations of functions. This interactive exercise focuses comparing linear, quadratic, and exponential functions and their graphical representations after completing a table to calculate ordered...
Khan Academy
Khan Academy: Rates and Proportional Relationships
A variety of questions about rates and proportional relationships involving graphs, tables, and equations. Students receive immediate feedback and have the opportunity to try questions repeatedly, watch a video, or receive hints.
Purple Math
Purplemath: Exponential Functions: Introduction
Purplemath offers tables and graphs of various exponential functions for an exploration of how exponential functions behave from the real number domain. Compound interest problems are examined and the natural exponential is discussed...
California State University
California State University, San Bernardino: Inverse Functions
This site has many links to examples of inverse functions, including intersections, inverse by reflection, and graphing inverse functions.
Texas Instruments
Texas Instruments: C Ds Anyone?
In this activity, students write rules for real world functions. They make a table to compare function values and graph linear functions on the coordinate plane.
Texas Instruments
Texas Instruments: Walking the Line
In this activity, students use linear functions to model and solve problems in situations with slope and a constant rate of change. They learn to represent situations with variables in expressions, equations, and inequalities and use...
Khan Academy
Khan Academy: Average Rate of Change: Graphs and Tables
Find a function's average rate of change over a specific interval, given the function's graph or a table of values. Students receive immediate feedback and have the opportunity to try questions repeatedly or receive hints.
CK-12 Foundation
Ck 12: Algebra: Input Output Tables for Function Rules
[Free Registration/Login may be required to access all resource tools.] Evaluate a function rule by finding outputs for a given input
CK-12 Foundation
Ck 12: Algebra: Domain and Range of a Function
[Free Registration/Login may be required to access all resource tools.] Find the domain and range of a function and make a table of values for a function.
Illustrative Mathematics
Illustrative Mathematics: F if the Customers
This is a beginning lesson on the concept of functions. The context is a business that has a database of customer names and phone numbers in a table and students must decide if a function is involved. Aligns with F-IF.A.1 and 8.F.A.1.
Texas Education Agency
Texas Gateway: Determining Slopes From Equations, Graphs, and Tables
Given algebraic, tabular, and graphical representations of linear functions, the student will determine the slope of the relationship from each of the representations.


