Hi, what do you want to do?
Science Education Resource Center at Carleton College
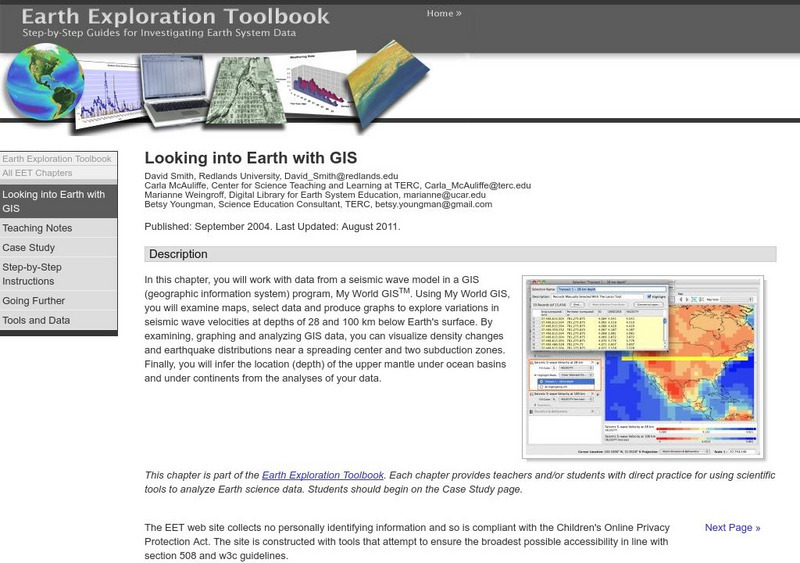
Serc: Looking Into Earth With Gis
Multi-lesson activity where students will work with data from a seismic wave model in a GIS (geographic information system) program. They will examine maps, select data, and produce graphs to explore variations in seismic wave velocities...
Science Education Resource Center at Carleton College
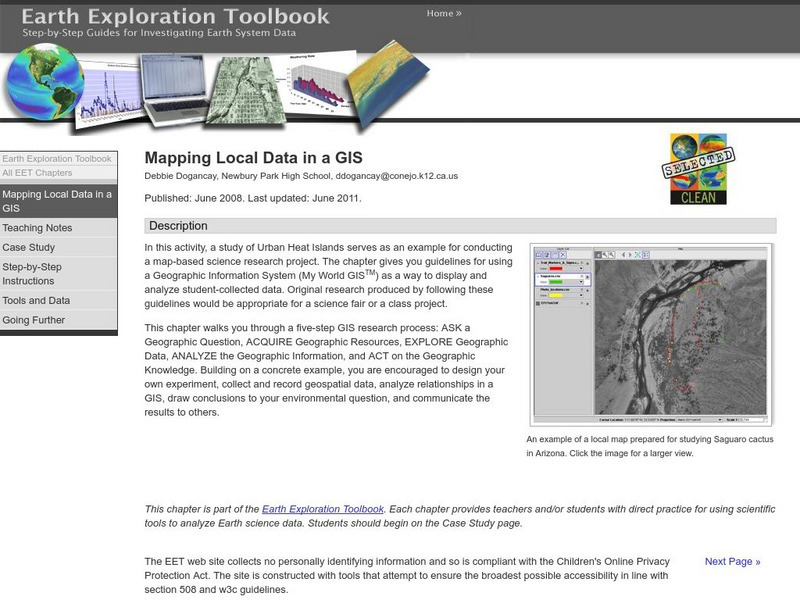
Serc: Mapping Local Data in a Gis
In this activity, young scholars will learn how to conduct a map-based science research project using a Geographic Information System (GIS). They will design an experiment, collect and record geospatial data, analyze geospatial...
American Geosciences Institute
American Geosciences Institute: Earth Science Week: Analyzing Hurricanes Using Web and Desktop Gis
In this activity, students research hurricane data to discover their behavior and patterns. They map them across decades to see whether their frequency is increasing. They study Hurricane Andrew and investigate the relationship between...
National Geographic
National Geographic: The Politics of Place Naming
Students use an online geographic information system (GIS) to uncover the geographic and social context of streets named after Martin Luther King, Jr. They map street locations to identify regional patterns in honoring King, consider...
Other
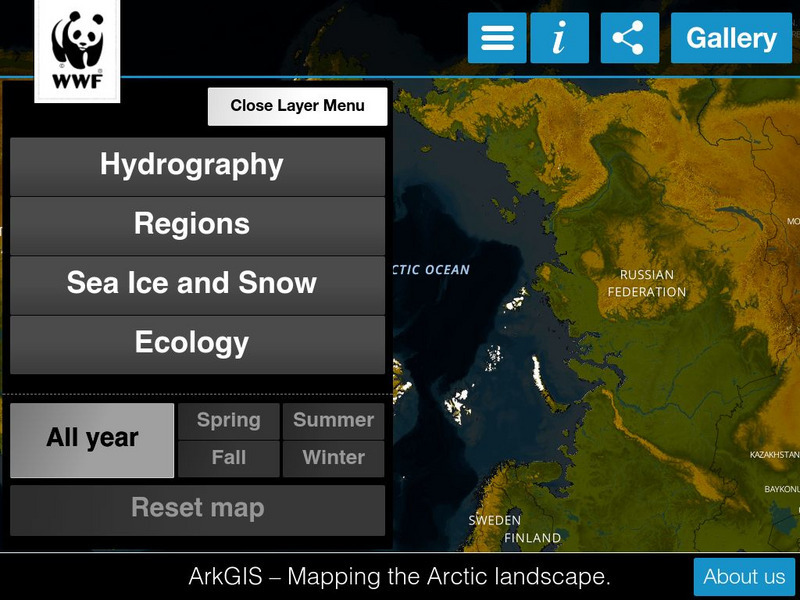
Ark Gis: Exploring the Arctic
Interactive mapping platform that combines and integrates existing data about the environment and human activity in the Arctic.
Association of Religion Data Archives
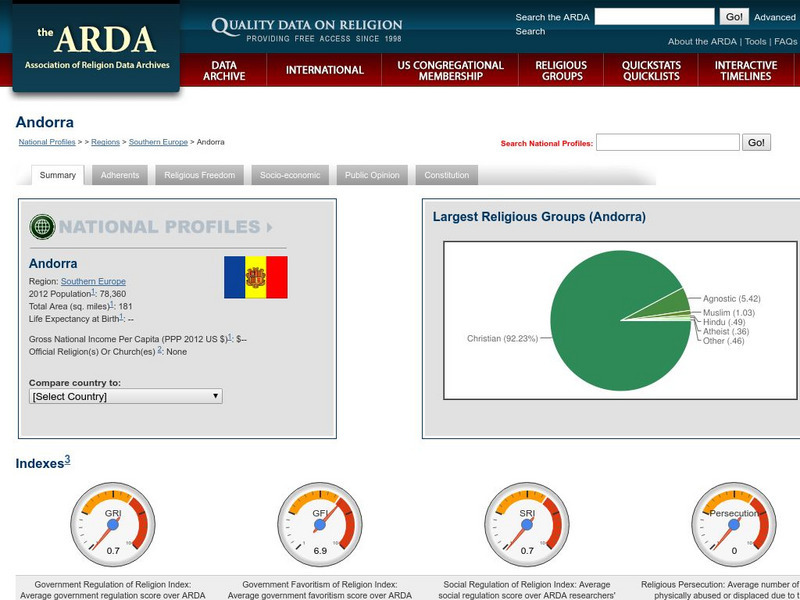
Association of Religion Data Archives: National Profiles: Andorra
Compilation of religious data and research about Andorra, along with regional and world comparisons. Includes select socioeconomic data, GIS maps (road, satellite, hybrid) and an insightful mix of information about religious membership...
Science Education Resource Center at Carleton College
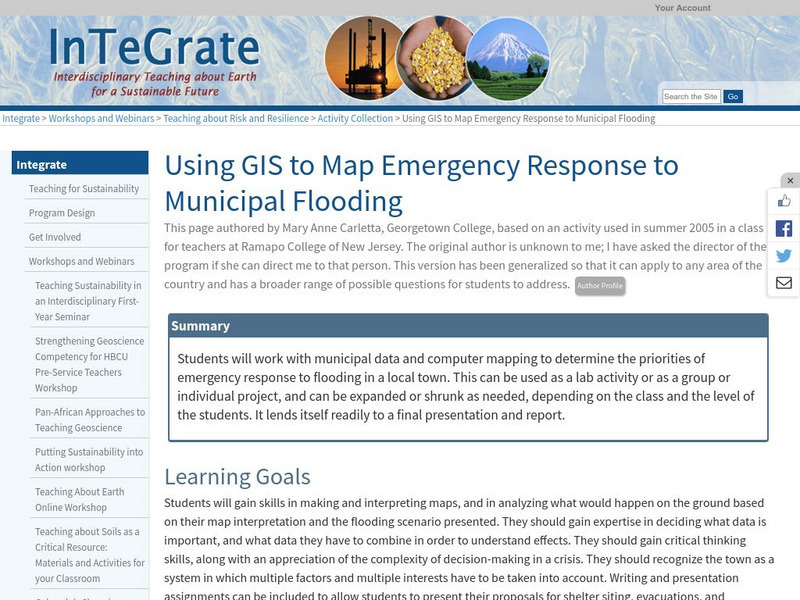
Serc: Using Gis to Map Emergency Response to Municipal Flooding
In this lesson students will work with municipal data and computer mapping to determine the priorities of emergency response to flooding in a local town. This can be used as a lab activity or as a group or individual project, and can be...
Columbia University
Nasa: Sedac: Population, Landscape, and Climate Estimates
[Free Registration/Login Required] A huge resource for researchers without GIS capabilities who need data on population and land area by country across a range of physical characteristics. These include measures such as the number of...
University of California
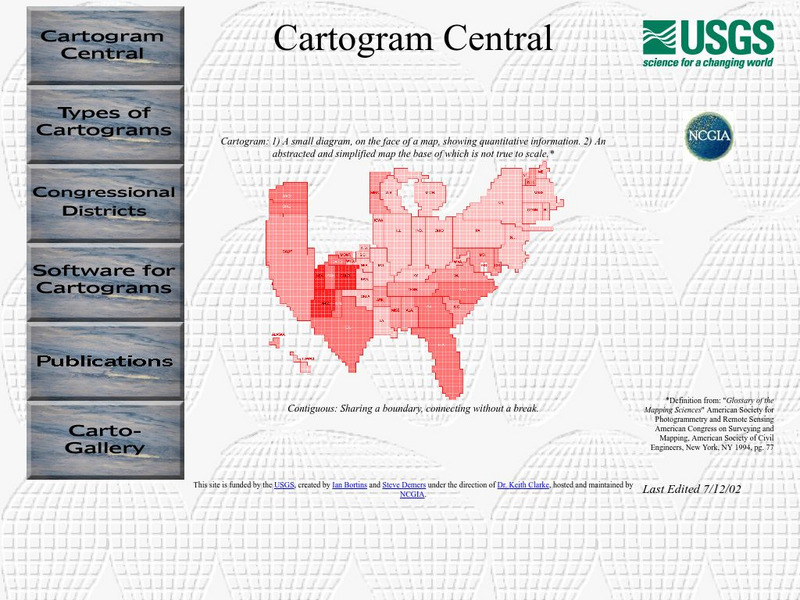
Us Geological Survey: Cartogram Central
The USGS offers detailed information on Types of Cartograms, Congressional Districts, Software for Cartograms, Publications, and a Carto-Gallery.
Other
Asia Foundation: Information and Communication Technology for Development [Pdf]
A two-page overview of how this organization supports the growth of information and communication technology in Asia, what types of technology it promotes, and why it is such an important issue to the development and modernization of...
US Geological Survey
U.s. Geological Survey
The U.S. Geological Survey reports on the latest news affecting the earth today, as well as providing a wealth of data, reports, and information.
Science Education Resource Center at Carleton College
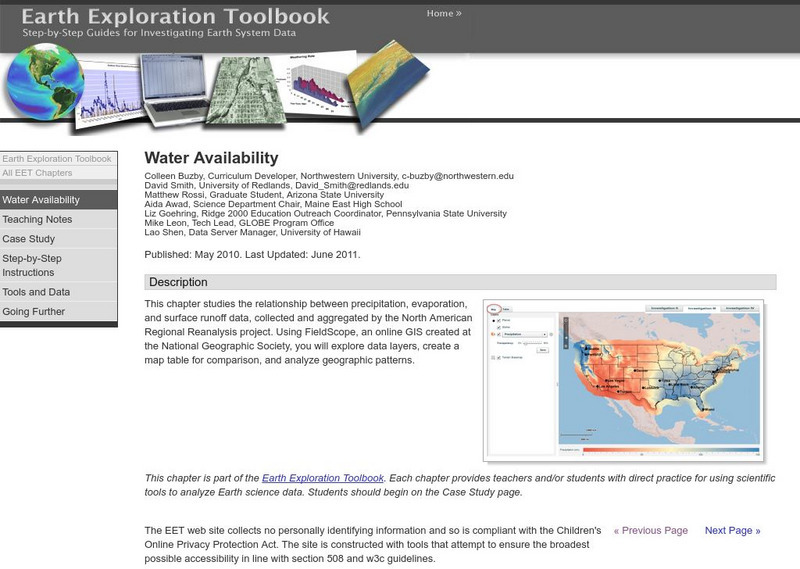
Serc: Water Availability
This instructional activity helps students discover the relationship between precipitation, evaporation, and surface runoff data. Using FieldScope, an online GIS created at the National Geographic Society, students will explore data...
Other
Ggmap: Spatial Visualization With Ggplot2 [Pdf]
In spatial statistics the ability to visualize data and models super imposed with their basic social landmarks and geographic context is invaluable. ggmap is a new tool which enables such visualization by combining the spatial...





![Asia Foundation: Information and Communication Technology for Development [Pdf] Article Asia Foundation: Information and Communication Technology for Development [Pdf] Article](https://static.lp.lexp.cloud/images/attachment_defaults/resource/large/FPO-knovation.png)
