Houghton Mifflin Harcourt
Houghton Mifflin Harcourt: Saxon Activity Center: Graphing Calculator Activity: Average [Pdf]
A concise graphing calculator lesson on calculating average. Detailed examples, demonstrations of calculator functions, and practice problems included. Acrobat Reader required.
Houghton Mifflin Harcourt
Houghton Mifflin Harcourt: Saxon Activity Center: Graphing Calculator Activity: Common Denominators [Pdf]
A graphing calculator lesson focusing on common denominator. Lesson contains detailed examples, visual demonstrations with key functions, and practice problems. Acrobat Reader required.
Houghton Mifflin Harcourt
Houghton Mifflin Harcourt: Saxon Activity Center: Graphing Calculator Activity: Positive and Negative [Pdf]
Order of operations with positive and negative numbers is the focus of this graphing calculator lesson. Included are detailed examples, demonstrations of key functions, and practice problems. Acrobat Reader required.
Houghton Mifflin Harcourt
Houghton Mifflin Harcourt: Saxon Activity Center: Graphing Calculator Activity: Proportions [Pdf]
A concise graphing calculator lesson on proportions. Detailed examples, demonstrations of functions, and practice problems included. Acrobat Reader required.
Texas Instruments
Texas Instruments: Study Cards App
This App allows teachers and students to create electronic flash cards to use as a study tool for quiz or test review. Students can also download prepared flash cards on many topics onto their graphing calculator.
Oswego City School District
Regents Exam Prep Center: Systems of Linear Equations
This website contains tutorials that cover the methods used to solve linear equations, substitution, elimination (adding & subtracting), and graphing. The practice pages allow students to practice the skills they have learned. On the...
PBS
Pbs: Using the Pythagorean Theorem on the Cartesian Graph
In this interactive, students use logic and mathematical skill to place animals at the correct points on a Cartesian graph representing the cardinal directions. Then, they use the Pythagorean theorem to determine the distances between...
Texas Instruments
Texas Instruments: This Is for the Birds!
This activity enables students to practice various skills such entering lists, comparing data, and utilizing statistical terms on the graphing calculator.
Texas Instruments
Texas Instruments: Numb3 Rs: The Art Gallery Problem
Based off of the hit television show NUMB3RS, this lesson introduces students to the Art Gallery Problem, in which cameras must be placed so that the entire area of a floor can be seen. Students use their graphing calculators extensively...
CK-12 Foundation
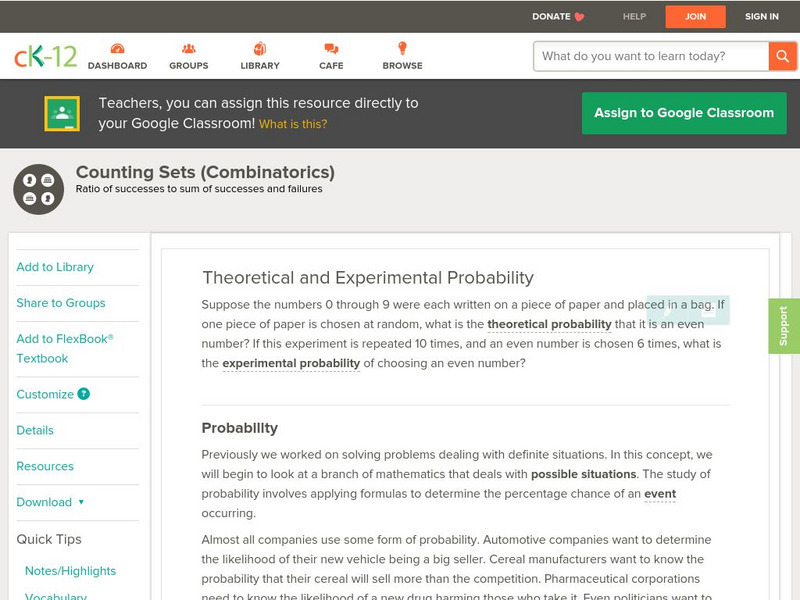
Ck 12: Probability: Theoretical and Experimental Probability
[Free Registration/Login may be required to access all resource tools.] Here you'll learn about theoretical and experimental probability, including how to describe sample spaces and how to conduct probability simulations. Includes...
PBS
Pbs: Horizontal and Vertical Distances on the Cartesian Graph
In this interactive, students use logic and mathematical skill to place aquatic animals at locations on a Cartesian graph with cardinal directions. Then, they determine both the vertical and horizontal distances between points. The...
Wyzant
Wyzant: Algebra Help
Heres a comprehensive review of the basics of algebra. WyzAnt includes lessons on varied topics, calculators that show step-by-step solutions, and interactive worksheets for practicing and testing your skills. Just choose a topic and use...
Texas Instruments
Texas Instruments: Handy Reflections
The purpose of this investigation is to: Revise plotting points on the Cartesian plane; Use and understand aspect ratios; Improve estimation skills; Use a spreadsheet or a graphing calculator to draw a graph; Learn how to reflect lines...
Oswego City School District
Regents Exam Prep Center: Multiple Choice Practice: Working With Data
Test your knowledge of working with data by taking this twenty question multiple-choice practice test. Use a graphing calculator to help with any graphing problems and check your answers at any given time throughout the test.
Shmoop University
Shmoop: Basic Algebra: Graphing Lines
The tutorial discusses slope and how to graph a line. Learners explore the concepts through notes and examples. Practice problems are included to check for comprehension of the algebra topics.
Texas Instruments
Texas Instruments: Differential Equations on the Ti 92 Plus
This activity acquaints students with the features and capabilities of the calculator that are used to study concepts related to differential equations. Students graph and solve a range of differential equation problems.
Texas Instruments
Texas Instruments: Features of the Ti 89 That Maximize Its Use
This Computer Algebra System (CAS) activity encourages students to investigate the various functions and applications of the CAS calculator. They study and practice various types of problems in algebra and calculus with the help of the...
Texas Instruments
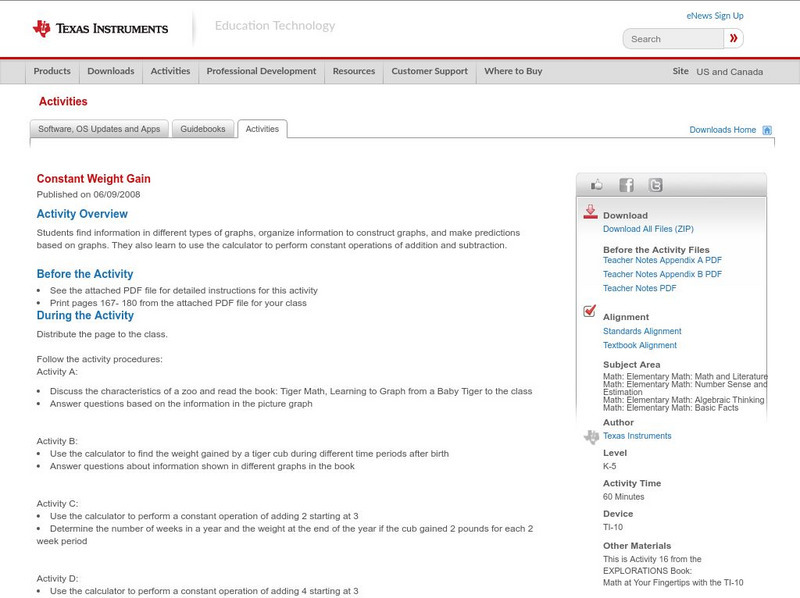
Texas Instruments: Constant Weight Gain
In this activity, students find information in different types of graphs, organize information to construct graphs, and make predictions based on graphs. They also learn to use the calculator to perform constant operations of addition...
Texas Instruments
Texas Instruments: Inverse of Two Temps
In this activity, students find a conversion equation that will calculate the corresponding Celsius temperature for any given Fahrenheit temperature. Students learn to graph scatter plots, analyze and graph linear equations, compute and...
Windstream
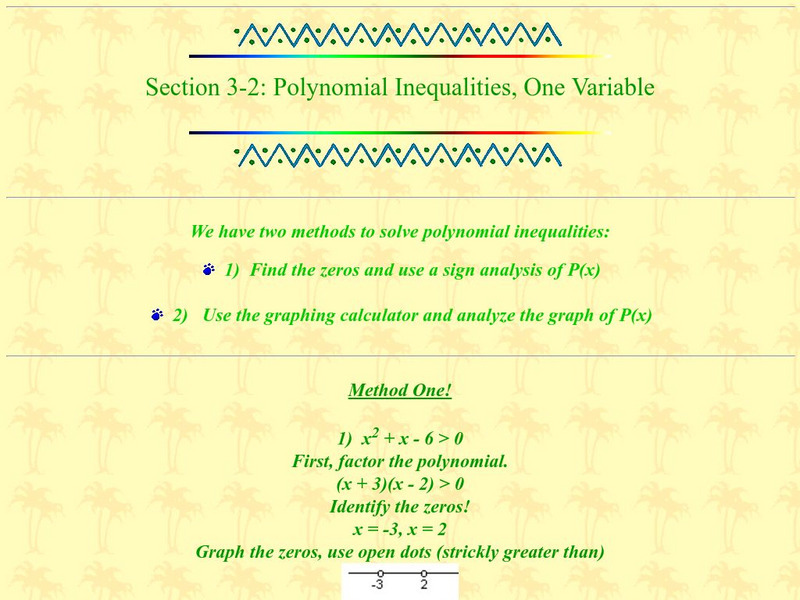
Ojk's Precalculus Study Page: Polynomial Inequalities, One Variable
This tutorial offers two methods to solve polynomial inequalities. Site includes several examples, charts, graphs, and other information for student understanding.
PBS
Pbs Teachers: Sports and Math: Batting Averages and More
Set up a spreadsheet using a computer or graphing calculator, and perform calculations using columns. Calculate percentages and solve a system of equations regarding baseball statistics.
Texas Instruments
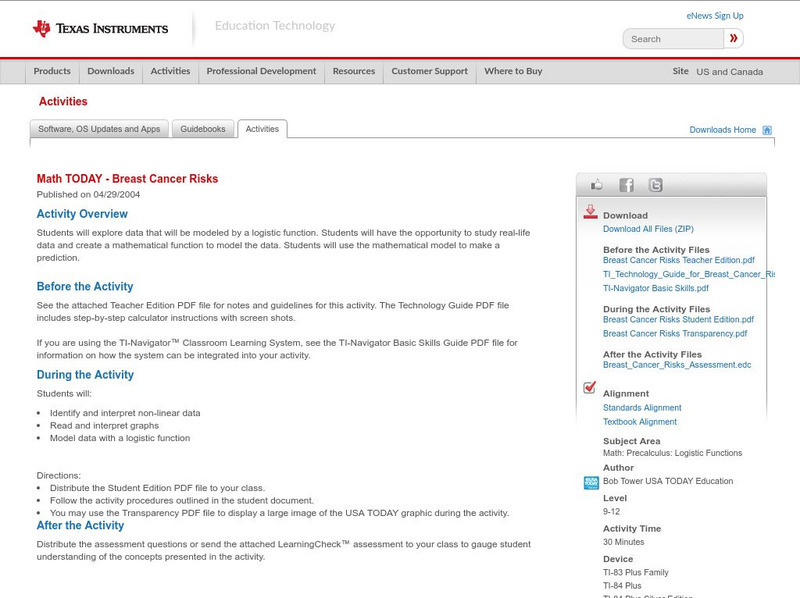
Texas Instruments: Math Today Breast Cancer Risks
Cross curricular lines while integrating technology into your classroom to study a real-world application of logistic regression. This activity shows students how to enter data into their graphing calculators and perform a regression in...
Council for Economic Education
Econ Ed Link: Focus on Economic Data: The Inflation Rate
Explore the inflation rate from 2013 through this informative case study. Trace the consumer trends through the graphs and charts on the site.
Oswego City School District
Regents Exam Prep Center: Statistical Studies, Central Tendency, and Dispersion
The mathematics tutorial investigates statistical studies, central tendency, and dispersion. The lesson consists of class notes, calculator tips, examples, and practice problems with solutions. The teacher resource includes an activity...
![Houghton Mifflin Harcourt: Saxon Activity Center: Graphing Calculator Activity: Average [Pdf] Unknown Type Houghton Mifflin Harcourt: Saxon Activity Center: Graphing Calculator Activity: Average [Pdf] Unknown Type](https://d15y2dacu3jp90.cloudfront.net/images/attachment_defaults/resource/large/FPO-knovation.png)


