Hi, what do you want to do?
Vision Learning
Visionlearning: Data: Using Graphs and Visual Data in Science
An explanation of how data can be turned into visual forms which can help people comprehend information easier than observing numbers.
Khan Academy
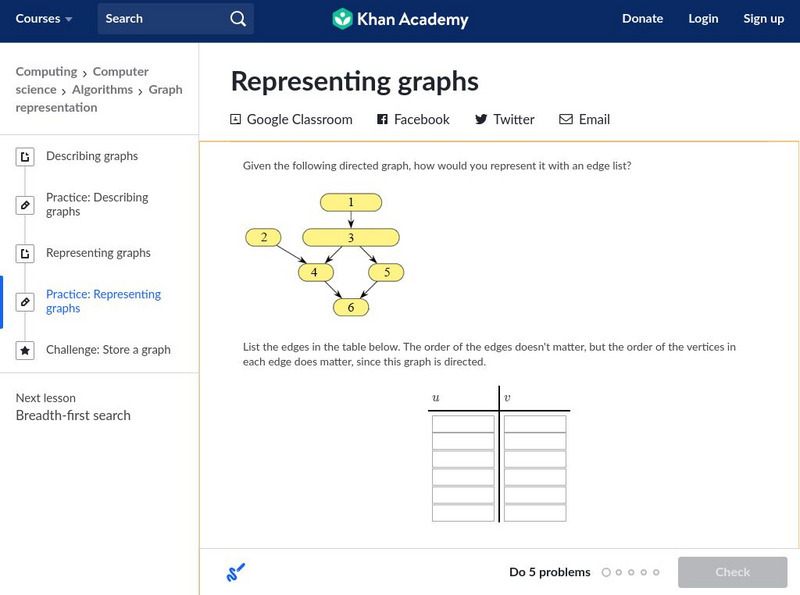
Khan Academy: Representing Graphs
Some practice problems with data and graph representation in computer science.
Science Buddies
Science Buddies: Data Analysis for Advanced Science Projects
The importance of data analysis in science projects is explained. Describes common mistakes young scientists make. The article then discusses how to find out what the standard methods of data analysis are for the type of research you...
Science Buddies
Science Buddies: An Experiment in Visual Perception
Graphical methods of data presentation are a key feature of scientific communication. This project will get you thinking about how to find the best way to communicate scientific information.
CK-12 Foundation
Ck 12: Physical Science: Scientific Graphing
[Free Registration/Login may be required to access all resource tools.] Usefulness and types of graphs.
Alabama Learning Exchange
Alex: "Ridin' Along in My Automobile"
Students will research prices of used cars to discover how automobiles lose their value over time. Students will create a chart to record their information, use their chart to graph their data, and find measures of central tendency of...
Scholastic
Scholastic: Dirtmeister's Science Lab: Let the Sun Shine In
Students graph data reflecting time of day and length of shadow, and then draw conclusions about Earth's seasons and position in relation to the Sun.
BSCS Science Learning
Bscs: Invitations to Inquiry With Data Using Field Scope
Invitations to Inquiry are short instructional activities designed to help middle and high school students work with large data sets. Teachers and students use the interactive FieldScope platform to collect, visualize, and analyze...
Texas Instruments
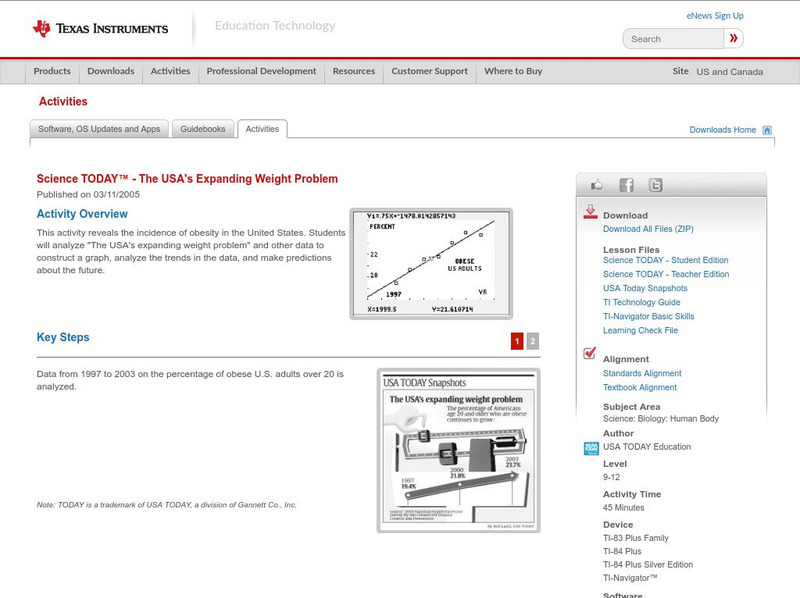
Texas Instruments: Science Today the Usa's Expanding Weight Problem
This activity reveals the incidence of obesity in the United States. Students will analyze "The USA's expanding weight problem" and other data to then construct a graph, analyze the trends in the data and make predictions about the future.
University of Utah
University of Utah: Genetic Science Learning Center: teach.genetics: Introduction to Heredity
A three-day unit introduces heredity by helping students identify their own genetic traits and then leading them in an exploration of generational traits and variation. Find printable worksheets, data tables, and graphs, as well as...
TeachEngineering
Teach Engineering: Graphing the Spread of Disease
Students simulate disease transmission by collecting data based on their proximity to other students. One option for measuring proximity is by having Bluetooth devices "discover" each other. After data is collected, students apply graph...
Other
Kindergarten lessons.com: Graphing Activities
Graphing activities for preschool and kindergarten include collecting data and organizing it in a variety of ways. There are lots of fun things to do in this area of math and the activities integrate well with science and literacy...
Alabama Learning Exchange
Alex: Incline Plane and the Crashing Marble
Students will measure the effects of the height of an inclined plane on the force a marble produces to move a plastic, foam, or paper cup across a table. Students will discover that the higher the incline plane, the more force produced...
Khan Academy
Khan Academy: Storing Data in Variables
Practice variable assignment in the AP CSP pseudocode, in this set of free practice questions designed for AP Computer Science Principles students.
Texas Instruments
Texas Instruments: The Science of Racing: Time Laps
In this activity, you will create a picture of time and speed as they relate to changes in the weight of a radio controlled race car. This picture will be a graph - a mathematical model- that allows to you predict the speed of your radio...
Science Education Resource Center at Carleton College
Serc: Balloon Rockets in 1 D
In this inquiry activity, students solve a 1D motion challenge in groups. Students build their own balloon rocket from the materials provided with little guidance from the instructor. They collect data and use it to prepare a position...
Other
A River Runs Through It Learning Project
For this year long learning project integrating mathematics and science, students solve environmental problems using data collection and problem solving concepts. Designed for upper elementary gifted students. Interactive components and...
Center for Innovation in Engineering and Science Education, Stevens Institute of Technology
Ciese Collaborative Projects: Down the Drain: How Much Water Do You Use?
How much water do you use everyday? Find out in this engaging investigation, where you compare your water usage with your classmates and other people around the world. An exploration filled with lots of math and science that students are...
Other
Water on the Web
Water on the Web (WOW) is an advanced site allowing students to actively participate in data analysis from real research sites. Lesson plans on a range of topics are provided. There is also a tutorial for using Excel to graph WOW data.
Alabama Learning Exchange
Alex: Ice Cream Sundae Survey
Students quickly realize the importance of learning how to read and find information in charts, graphs, and tables compared to finding the same information written in a paragraph. This is a fun, high energy lesson!This lesson plan was...
Science Education Resource Center at Carleton College
Serc: Introduction to Texas Hurricanes
In this activity, students are asked to graph data about some 20th century hurricanes that hit the Texas coastline. For each graph, they are asked several questions about any apparent correlation between the different variables. Students...
My Science Site
Bj's Science: Take a Walk! [Pdf]
In this activity students literally walk through this activity calculating acceleration. Also, students calculate speed, graph acceleration, as well as do statistical data analysis. This resource is in PDF form; requires Adobe Reader.
Physics World
Physics World: Contextual Physics in Ocean Park
After downloading the "Motion Video Analysis" software, users can collect data about moving object's position from digital movie clips. This collection of data will allow them to plot motion graphs and draw conclusions about physics in...
ClassFlow
Class Flow: Fitting Models to Data
[Free Registration/Login Required] A basic premise of science is that much of the physical world can be described mathematically and many physical phenomena are predictable. This scientific outlook took place in Europe during the late...


