Texas Instruments
Texas Instruments: Math Today the Next Frontier for Flight
This activity provides students the opportunity to gain experience in creating circle graphs on the calculator and provides an excellent real-world review of computation with percents.
Texas Instruments
Texas Instruments: Graphing Calculators
Contains information on different kinds of Texas Instruments graphing calculators.
Texas Instruments
Texas Instruments: Differential Equations on the Ti 92 Plus
This activity acquaints students with the features and capabilities of the calculator that are used to study concepts related to differential equations. Students graph and solve a range of differential equation problems.
Texas Instruments
Texas Instruments: Let's Play Ball With Families of Graphs
This activity is designed for students to use real-time data to generate a family of parabolic graphs. The data set will be generated by graphing the heights of a ball bounce with respect to time. Students will determine the regression...
Texas Instruments
Texas Instruments: Implicit Differentiation on the Ti 89
This activity demonstrates implicit differentiation on the graphing calculator.
Texas Instruments
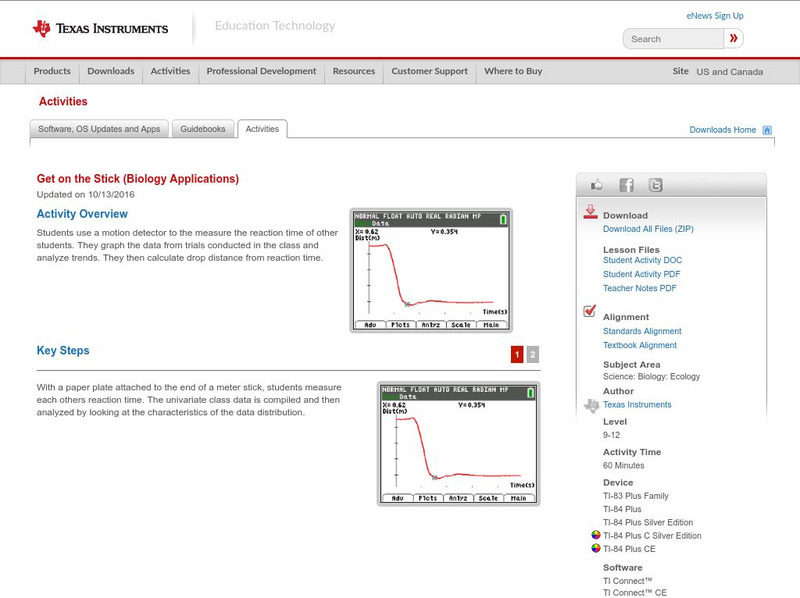
Texas Instruments: Get on the Stick
In this activity, students' use a motion detector to the measure the reaction time of students. They graph the data from trials conducted in the class and analyze trends. They then calculate drop distance from reaction time.
University of Illinois
University of Illinois Urbana Champaign: Ti 82 Calculator Tutorial
This site gives an in depth tutorial on the TI-82 graphing calculator. With each step in the tutorial, a picture of the calculator is shown that can be enlarged.
Texas Instruments
Texas Instruments: Numb3 Rs: Seeing in the Dark
Based off of the hit television show NUMB3RS, this lesson has students try to emulate a time vs. distance graph on their graphing calculator using the CBR2. Next, the CBR2 is "swept" across an area in which three students are standing to...
Texas Instruments
Texas Instruments: Where Should They Hold the Fundraising Party?
Students learn how to create a table of values for a simple linear function and use the table to create a graph on squared paper. They use the graphing calculator to display the ordered pairs and find values of corresponding to values of...
Texas Instruments
Texas Instruments: Intersection of a Line With a Parabola
In this activity, students use Computer Algebra System (CAS) tools to find intersections of linear and non-linear equations. They confirm their answers by graphing the equations on the calculator.
Texas Instruments
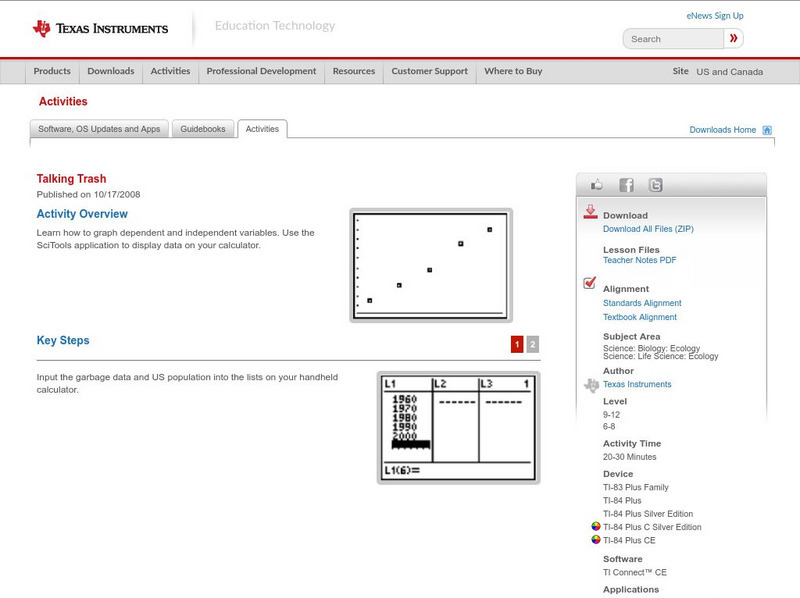
Texas Instruments: Talking Trash
Learn how to graph dependent and independent variables. Use the SciTools application to display data on your calculator.
Texas Instruments
Texas Instruments: What's in a Name? Explorations in the Coordinate Plane From
Students will plot points in a coordinate plane and reflect those points across the axes using a MIRA and then using the graphing calculator STAT, STAT PLOT, and GRAPH menus graph the image on the graphing calculator screen.
Texas Instruments
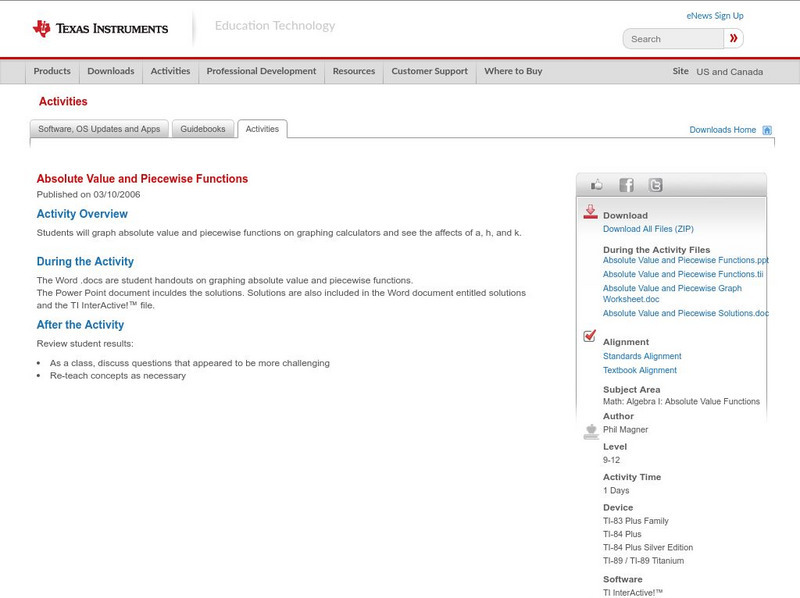
Texas Instruments: Absolute Value and Piecewise Functions
Students will graph absolute value and piecewise functions on graphing calculators and see the effects of a, h, and k.
Texas Instruments
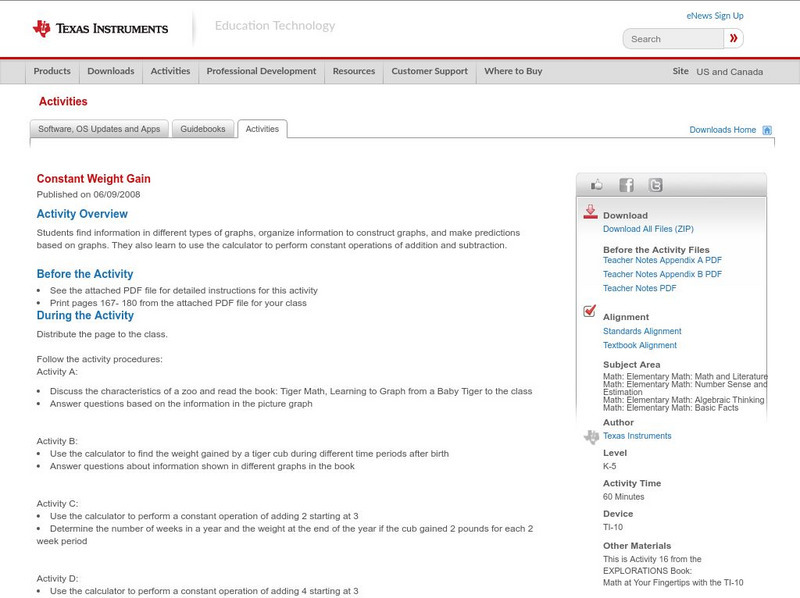
Texas Instruments: Constant Weight Gain
In this activity, students find information in different types of graphs, organize information to construct graphs, and make predictions based on graphs. They also learn to use the calculator to perform constant operations of addition...
Richland Community College
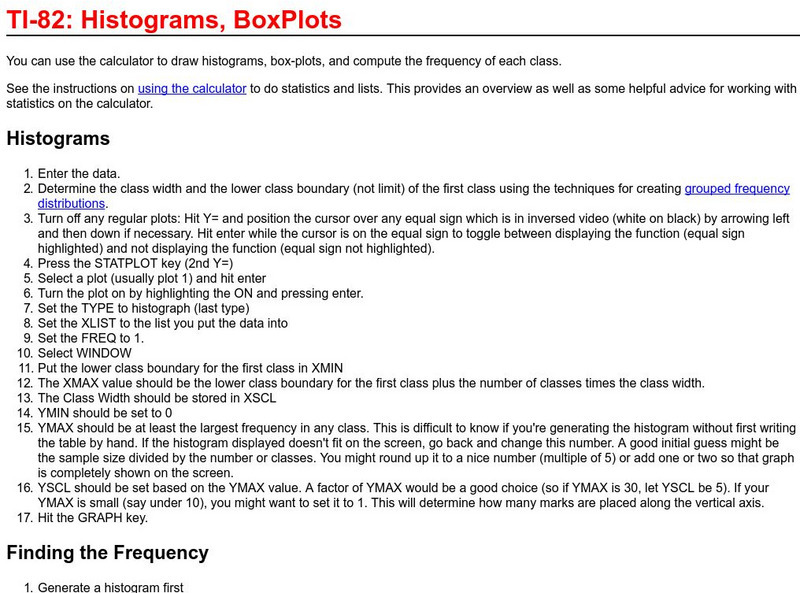
Richland College: Ti 82 Histograms / Box Plots
Richland College provides a step-by-step procedure on how to use a TI-82 to construct histograms and box plots and then use this to find frequency distribution.
Texas Instruments
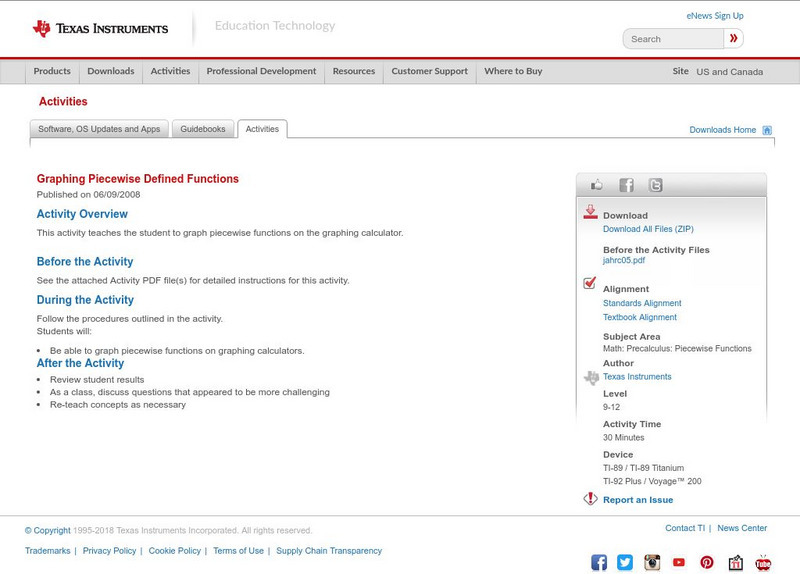
Texas Instruments: Piecewise Defined Functions
Learn how to graph a piecewise defined function on the TI-89 graphing calculator. Precise keystroke instructions and calculator screenprints are included in this lesson plan and student activity page.
Texas Instruments
Texas Instruments: Exploring the Vertex Form of the Quadratic Function
Examine the changes in a graph of a quadratic function that occur when different transformations are applied to the vertex form of the equation. Students will need to have the transformation graphing application on their TI-83+...
Texas Instruments
Texas Instruments: This Is for the Birds!
This activity enables students to practice various skills such entering lists, comparing data, and utilizing statistical terms on the graphing calculator.
Texas Instruments
Texas Instruments: Probability, Simulations, and Probability Distributions
Use simulation on the TI-83 graphing calculator to teach students about the distribution of sample proportions, distribution of sample means, the Central Limit Theorem, normal probability plots, and the Law of Large Numbers. Pick and...
Texas Instruments
Texas Instruments: Numb3 Rs: Spiraling Out
Based off of the hit television show NUMB3RS, this lesson gives students further insight into the various spirals that can be graphed using polar equations. While the lesson assumes that students already have some background with polar...
Texas Instruments
Texas Instruments: Study Cards App
This App allows teachers and students to create electronic flash cards to use as a study tool for quiz or test review. Students can also download prepared flash cards on many topics onto their graphing calculator.
Texas Instruments
Texas Instruments: A Steep Hike Adventure 3
Students use the CBR 2 to gather distance and time data for various walking speeds. They observe the effect of change in direction and speed of motion on distance versus time graphs. Students interpret and analyze graphs, calculate slope...
Texas Instruments
Texas Instruments: "You're Hired!"
This activity will use linear programming and the Inequalz apps on the TI-84+ calculator to solve real world problems.
Texas Instruments
Texas Instruments: Handy Reflections
The purpose of this investigation is to: Revise plotting points on the Cartesian plane; Use and understand aspect ratios; Improve estimation skills; Use a spreadsheet or a graphing calculator to draw a graph; Learn how to reflect lines...


