National Council of Teachers of Mathematics
The Math Forum: Chameleon Graphing: Coordinate Plane
Dive into this introduction to graphing in the coordinate plane, and meet a chameleon named Sam. Sam will help guide you through graphing points on a line, using negative numbers, and graphing points in the coordinate plane.
Texas Instruments
Texas Instruments: Pumpkin Graph an Activity for Plotting Points
Students are given 3 - 4 points to plot in activity center. Students practice plotting points an can review the coordinate plane.
TeachEngineering
Teach Engineering: A Lego Introduction to Graphing
Students use a LEGO ball shooter to demonstrate and analyze the motion of a projectile through use of a line graph. This activity involves using a method of data organization and trend observation with respect to dynamic experimentation...
Houghton Mifflin Harcourt
Holt, Rinehart and Winston: Homework Help Independent Practice: Point Slope Form
Get independent practice working with Point-Slope Form. Each incorrect response gets a text box explanation and another try. Correct responses are confirmed.
Houghton Mifflin Harcourt
Houghton Mifflin Harcourt: Saxon Activity Center: Graphing Calculator Activity: The Coordinate Plane [Pdf]
A graphing calculator lesson on coordinate planes. Detailed examples, demonstrations with key functions, and practice problems included. Acrobat Reader required.
Shodor Education Foundation
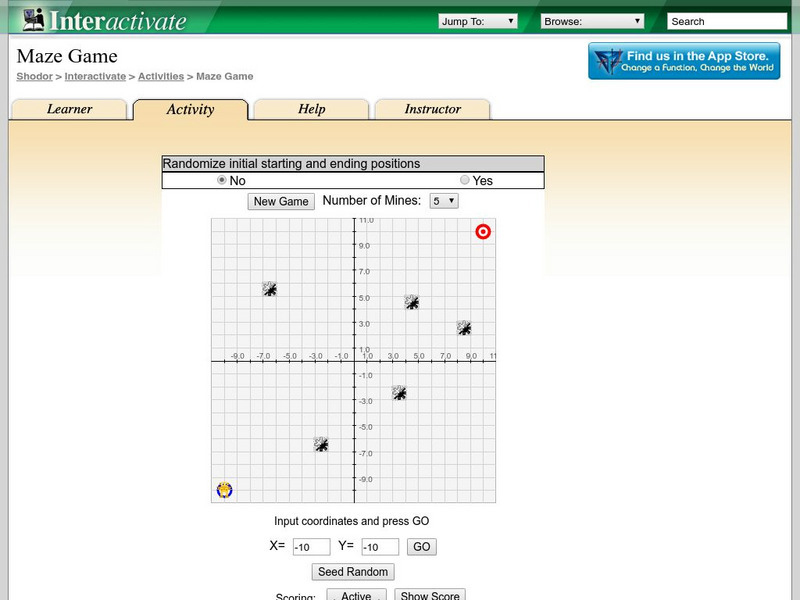
Shodor Interactivate: Maze Game
The interactive learning game has students practice their point plotting skills as they move through a mine field. The goal of the game is to get to a target location without crossing a mine.
Shodor Education Foundation
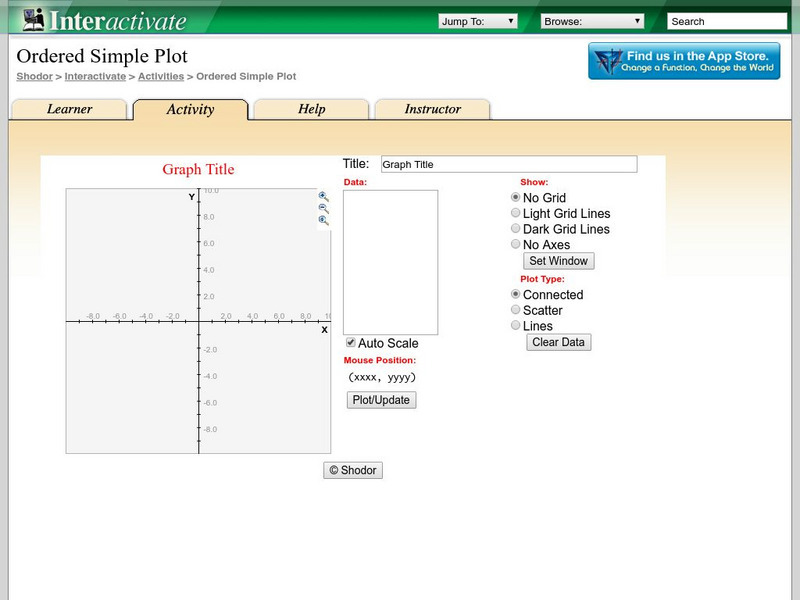
Shodor Interactivate: Ordered Simple Plot
The interactive learning activity allows students to plot multiple ordered pairs. Teacher resources are included.
TeachEngineering
Teach Engineering: Pointing at Maximum Power for Pv
Student teams measure voltage and current in order to determine the power output of a photovoltaic (PV) panel. They vary the resistance in a simple circuit connected to the panel to demonstrate the effects on voltage, current, and power...
Texas Instruments
Texas Instruments: Getting Started With the Ti Navigator: Coordinate Graphing
This lesson introduces students to Activity Center and is intended to help students develop an initial conceptual understanding of how to plot a set of points using a coordinate grid and to create lists to represent the ordered pairs for...
Texas Instruments
Texas Instruments: Design Graphing Project
Students create a design by connecting points in the coordinate plane. They then program their calculators to display their designs.
PBS
Pbs: Horizontal and Vertical Distances on the Cartesian Graph
In this interactive, students use logic and mathematical skill to place aquatic animals at locations on a Cartesian graph with cardinal directions. Then, they determine both the vertical and horizontal distances between points. The...
Oswego City School District
Regents Exam Prep Center: Slopes and Equations of Lines
Explanation of linear equations and four types of slopes: positive, negative, zero, and undefined. Practice problems for the students are provided and a reinforcement activity using a graphing calculator is offered for the teacher's use.
PBS
Pbs: Using the Pythagorean Theorem on the Cartesian Graph
In this interactive, students use logic and mathematical skill to place animals at the correct points on a Cartesian graph representing the cardinal directions. Then, they use the Pythagorean theorem to determine the distances between...
University of Regina (Canada)
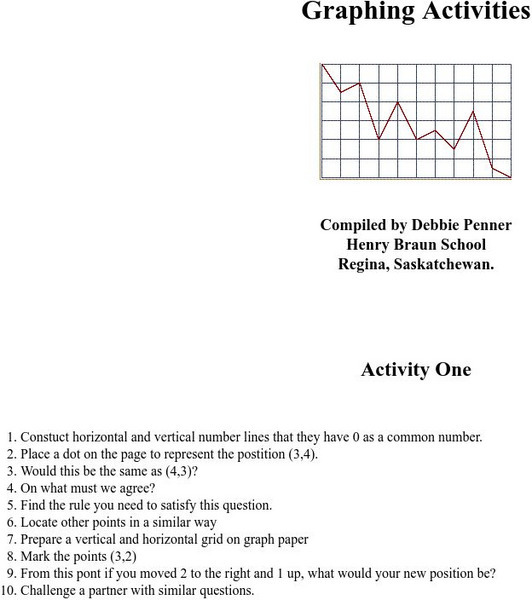
University of Regina: Math Central: Graphing Activities
Eighteen different graphing activities will teach students how to plot points, draw lines, compare graphs, and problem solve.
University of Regina (Canada)
University of Regina: Math Central: Graphing Activities
Eighteen different graphing activities will teach students how to plot points, draw lines, compare graphs, and problem solve.
The Franklin Institute
Frankin Institute Online: Group Graphing
This site from The Franklin Institute explores how to make a simple graph using a spreadsheet to portray survey data. It also gives a set of interesting sports-related web sites so that students can get statistical inforamtion.
Utah Education Network
Uen: Water Pollution Graphing: Bugs Don't Bug Me
Activity shows the link between land use activities within a watershed and water quality.
Houghton Mifflin Harcourt
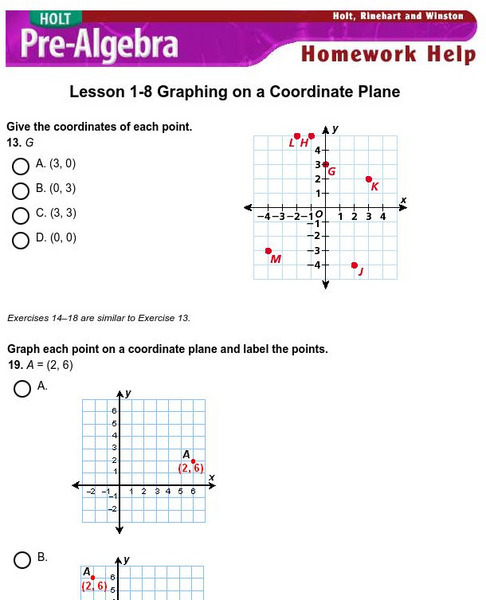
Holt, Rinehart and Winston: Homework Help Independent Practice: Coordinate Plane
Get independent practice identifying points, graphing points and equations on the coordinate plane. Each incorrect response gets a text box explanation and another try. Correct responses are confirmed.
Texas Instruments
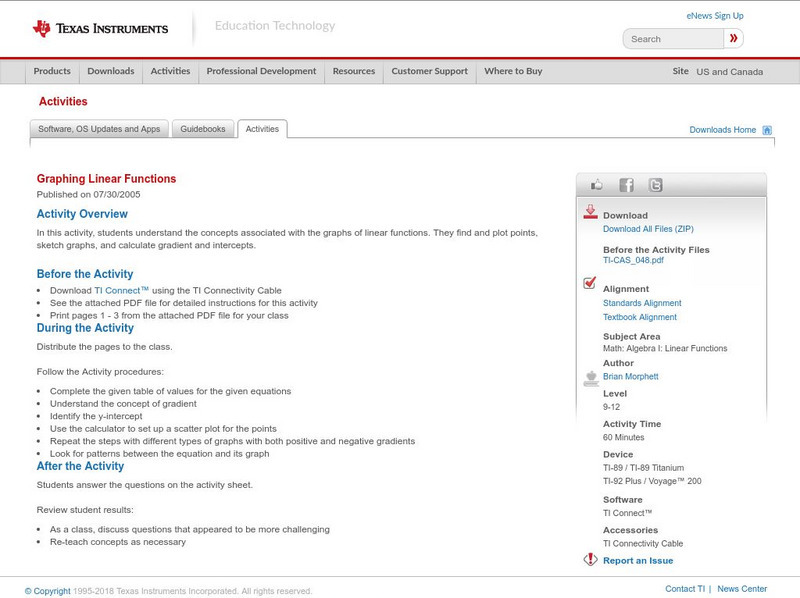
Texas Instruments: Graphing Linear Functions
In this activity, students understand the concepts associated with the graphs of linear functions. They find and plot points, sketch graphs, and calculate gradient and intercepts.
Shodor Education Foundation
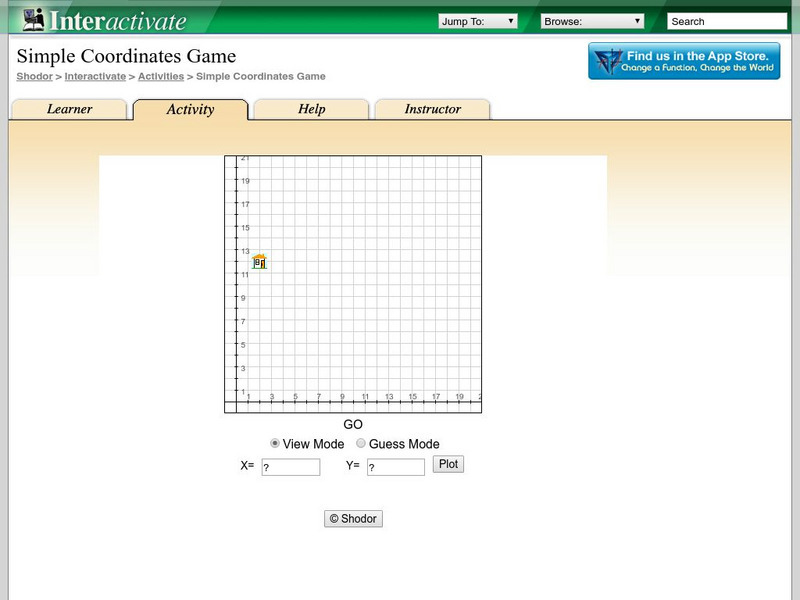
Shodor Interactivate: Simple Coordinates Game
This applet lets you play a game where you practice locating specific points using the first quadrant on the coordinate grid. Directions are only a click away.
Texas Instruments
Texas Instruments: Graph of Functions and Their Derivatives
In this activity, students observe the derivative as an indicator of increasing/decreasing function behavior. They also see that the derivative is an indicator of local maxima/ minima function behavior. Students learn to associate the...
Texas Instruments
Texas Instruments: Linear Regression: Wing Span/height
Students take measurements of individual's wing span and height and create a coordinate graph. The activity should include at least three different grade levels. Students submit an equation through "Activity Center" and the class...
Texas Instruments
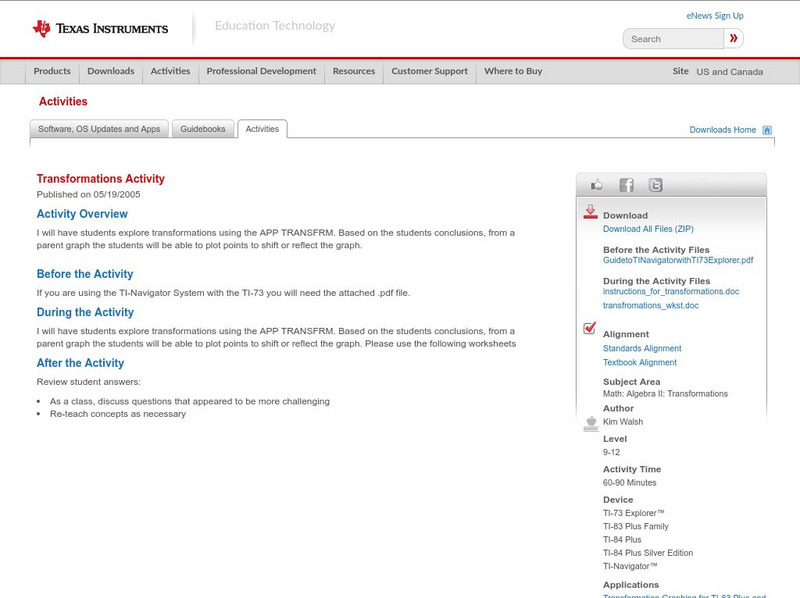
Texas Instruments: Transformations Activity
In this activity students explore transformations using the T.I. APP TRANSFRM. Based on the students conclusions, from a parent graph they will be able to plot points to shift or reflect the graph.
Texas Instruments
Texas Instruments: Match the Graph
Students use the Cabri Geometry II Plus software to reflect points from a graph across the axes.


![Houghton Mifflin Harcourt: Saxon Activity Center: Graphing Calculator Activity: The Coordinate Plane [Pdf] Unknown Type Houghton Mifflin Harcourt: Saxon Activity Center: Graphing Calculator Activity: The Coordinate Plane [Pdf] Unknown Type](https://d15y2dacu3jp90.cloudfront.net/images/attachment_defaults/resource/large/FPO-knovation.png)
