Hi, what do you want to do?
Government of Alberta
Learn Alberta: Math Interactives: Exploring Data Display and Graphs
This multimedia Learn Alberta math resource focuses on graphing data. In the video portion, students will see how math is involved in the display of merchandise in stores. The accompanying interactive component provides an exploration...
CK-12 Foundation
Ck 12: Statistics: Data Display Choices Grades 6 7
[Free Registration/Login may be required to access all resource tools.] Create surveys and display data using different types of graphs.
Other
Stat Trek: Data Patterns in Statistics
This lesson looks at how to recognize patterns in a data display by examining the shape of a graph, the center, the spread, and unusual features such as outliers. Includes video. [11:16]
Texas Education Agency
Texas Gateway: Selecting and Using Representations for Collected Data
[Accessible by TX Educators. Free Registration/Login Required] Given a variety of data (including line plots, line graphs, stem and leaf plots, circle graphs, bar graphs, box and whisker plots, histograms, and Venn diagrams), the student...
National Center for Ecological Analysis and Synthesis, University of California Santa Barbara
Kids Do Ecology: Data and Science
Learn about conducting your own investigation with these tips on following the scientific method. Find out how to state hypothesis, make observations, collect and analyze data, and display data to share results and conclusions of your...
National Council of Teachers of Mathematics
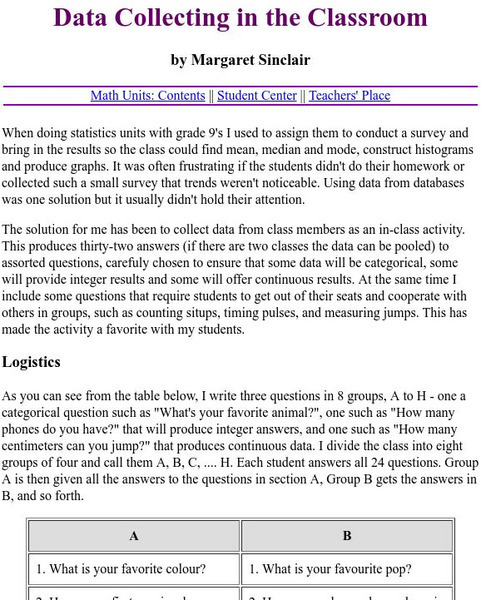
The Math Forum: Data Collecting in the Classroom
A list of two dozen questions students can easily ask eachother in the classroom to quickly collect data in hopes of using it in their study of making graphs. Some are opinion questions, while others require the counting of certain items...
Khan Academy
Khan Academy: Comparing Data Displays
Practice interpreting and comparing dot plots, histograms, and box plots. Students receive immediate feedback and have the opportunity to try questions repeatedly, watch a video or receive hints.
McGraw Hill
Glencoe: Self Check Quizzes 1 Using Bar and Line Graphs
Use Glencoe's randomly generated self-checking quiz to test your knowledge of using bar and line graphs. Each question has a "Hint" link to help. Choose the correct answer for each problem. At the bottom of the page click the "Check It"...
CK-12 Foundation
Ck 12: Types of Data Representation: Graphic Displays of Data
[Free Registration/Login may be required to access all resource tools.] Here you will explore displays of data using bar charts, histograms, pie charts and boxplots, and learn about the differences and similarities between them and how...
Shodor Education Foundation
Shodor Interactivate: Comparison of Univariate and Bivariate Data
Young scholars learn about the difference between univariate and bivariate data and understand how to choose the best graph to display the data.
American Association of Physics Teachers
Com Padre Digital Library: Open Source Physics: Data Tool Program
Use this online data analysis tool to build graphs and display results from scientific investigations. Data can be entered directly with the keyboard or imported from, and exported to spreadsheets.
E-learning for Kids
E Learning for Kids: Math: Carnival Parade in Rio: Chance & Data
Help Louis during the Carnival with graphs and chances.
E-learning for Kids
E Learning for Kids: Math: Elephant Plant: Data
Gyan's family grows flowers. Can you help him interpret displayed data about their plants?
CK-12 Foundation
Ck 12: Statistics: Line Graphs to Display Data Over Time
[Free Registration/Login may be required to access all resource tools.] Create line graphs to display how data changes over time.
Better Lesson
Better Lesson: Graph Party
First graders will be involved in creating three different types of graphs and then be asked to answer questions about each representations data set.
McGraw Hill
Glencoe: Self Check Quizzes 1 Analyzing Graphs
Use Glencoe's randomly generated self-checking quiz to test your knowledge of how to analyze graphs. Each question has a "Hint" link to help. Choose the correct answer for each problem. At the bottom of the page click the "Check It"...
Other
Bscs: Frog Symphony
In this self-directed instructional activity, students use maps and graphs of data to investigate the habitats and time of year and day to hear a full chorus of frogs. A handout with everything the student needs to complete this...
CK-12 Foundation
Ck 12: Statistics: Basic Graph Types
[Free Registration/Login may be required to access all resource tools.] Organize distributions of data by using a number of different methods.
BBC
Bbc: Representing Data
This BBC Math Bite tutorial for line graphs, pictograms, and frequency polygons features an exam in which students draw and interpret statistical diagrams.
E-learning for Kids
E Learning for Kids: Math: Rice Field: Data and Length
On this interactive website students practice various math skills using a real life scenario of a rice field. Those skills include understanding information displayed in column graphs, collecting data to answer a question, and measuring...
CK-12 Foundation
Ck 12: Statistics: Line Graphs Grade 7
[Free Registration/Login may be required to access all resource tools.] Make a line graph to display data over time.
CK-12 Foundation
Ck 12: Statistics: Multiple Line Graphs
[Free Registration/Login may be required to access all resource tools.] Make multiple line graphs to display and compare given data.
CK-12 Foundation
Ck 12: Statistics: Displaying Categorical Variables
[Free Registration/Login may be required to access all resource tools.] This Concept covers a few ways in which categorical data can be displayed; using bar graphs and pie graphs.
Better Lesson
Better Lesson: Line Graph Activity
Data collected is represented in tables and the students will need to choose what they want to represent in their line graph.


