Science Buddies
Science Buddies: Interpreting Area Data From Maps vs. Graphs
Graphical methods of data presentation are a key feature of scientific communication. This project asks the question, "What's the best way to compare the land area of states: a map or a bar graph?" You'll be measuring performance on two...
The Wonder of Science
The Wonder of Science: 5 Ess2 2: Water Availability and Distribution
With these lessons, student can provide evidence to how water is distributed around Earth by interpreting graphs of the amounts and percentages of water in various reservoirs. On this site find work samples, phenomena, assessment...
Vision Learning
Visionlearning: Data: Using Graphs and Visual Data in Science
An explanation of how data can be turned into visual forms which can help people comprehend information easier than observing numbers.
US Geological Survey
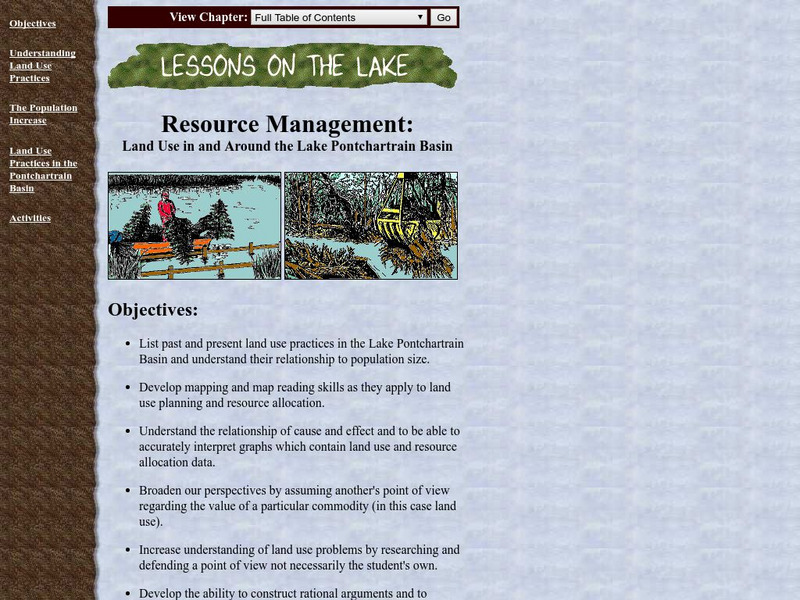
Lake Pontchartrain Basin Foundation: Resource Management
A variety of activities to show students how population size relates to how land is used in the Lake Pontchartrain Basin. Activities provide opportunities for students to interpret graphs, read maps, research problems, defend a side, and...
NASA
Nasa: Why Is Carbon Important?
Students explore the relationship between atmospheric carbon dioxide concentrations and temperature, and how these relate to climate change. Graph and map data are used as evidence to support the scientific claims they develop through...
Missouri State University
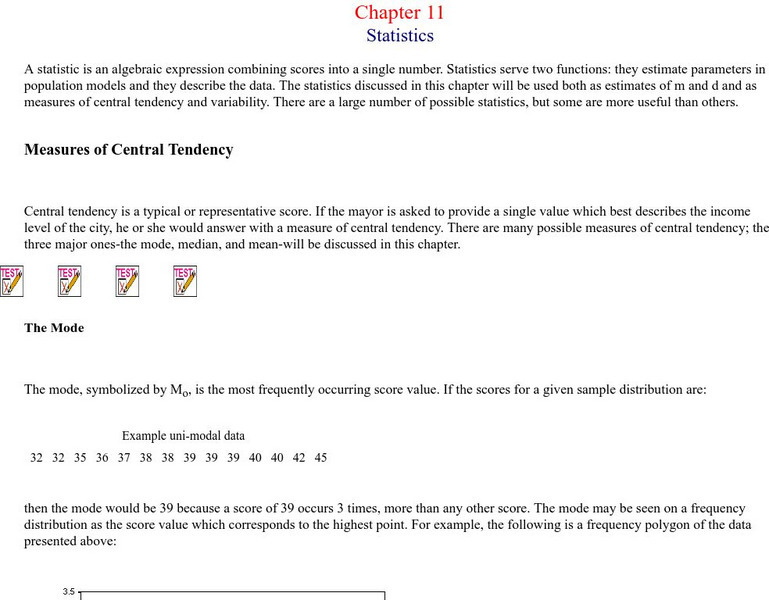
Missouri State University: Introductory Statistics: Statistics
This is an excellent resource on what the science of statistics involves. There are all kinds of definitions, examples, graphs, and charts to learn from. The topics covered include: mode, mean, median, skewed distributions and measures...


