Khan Academy
Khan Academy: Interpreting Graphs of Proportional Relationships
Practice reading and analyzing graphs of proportional relationships. Students receive immediate feedback and have the opportunity to try questions repeatedly, watch a video or receive hints.
Math Graphs
Houghton Mifflin: Math Graphs: Interpreting a Graph 3 [Pdf]
Students identify or sketch quantities using a given graph. The resource consists of an enlarged printable version of a math graph available in PDF format.
Math Graphs
Houghton Mifflin: Math Graphs: Interpreting a Graph 2 [Pdf]
Students identify or sketch quantities using a given graph. The resource consists of an enlarged printable version of a math graph available in PDF format.
Government of Alberta
Learn Alberta: Math Interactives: Exploring Data Display and Graphs
This multimedia Learn Alberta math resource focuses on graphing data. In the video portion, students will see how math is involved in the display of merchandise in stores. The accompanying interactive component provides an exploration...
Khan Academy
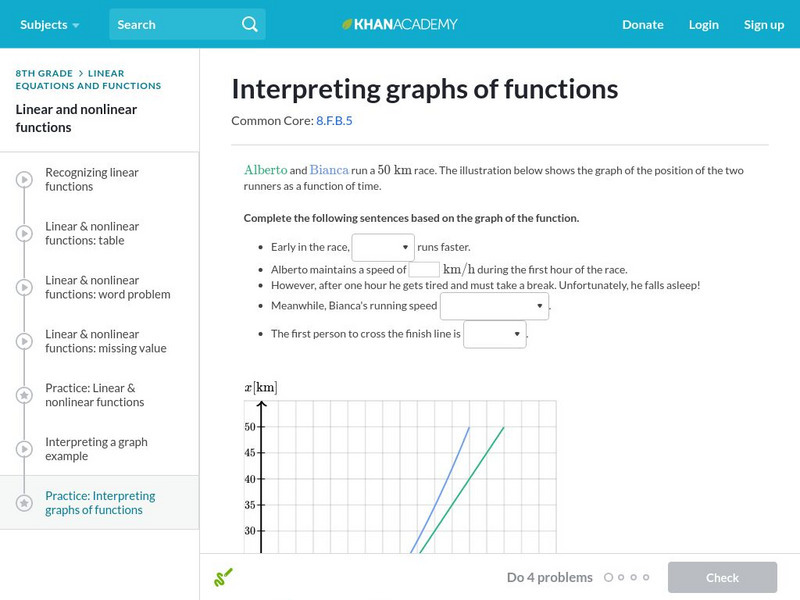
Khan Academy: Interpreting Graphs of Functions
Interpret the graphs of both linear and nonlinear functions. Students receive immediate feedback and have the opportunity to try questions repeatedly, watch a video, or receive hints.
PBS
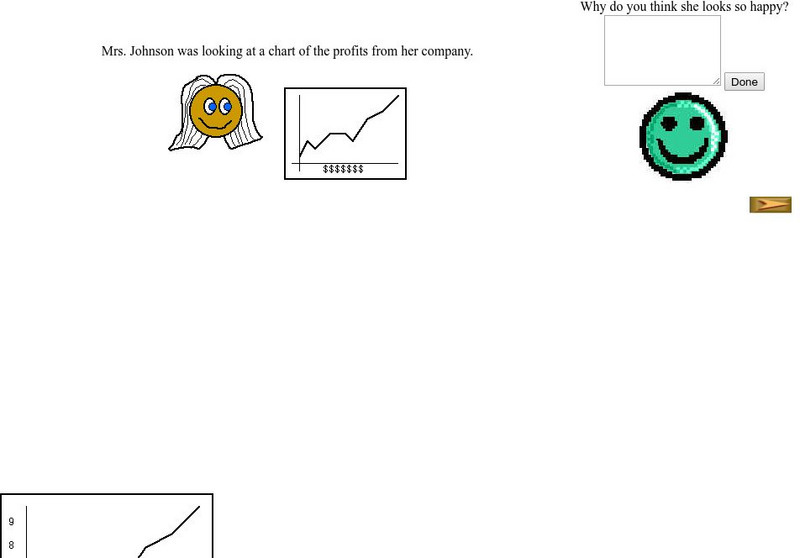
Pbs: Location Graphs
Use your skills of deduction to fill in the missing information and demonstrate your expertise at interpreting graphs. This interactive exercise focuses on how line graphs can be used to represent data and provides an opportunity to...
Khan Academy
Khan Academy: Graph Interpretation Word Problems
Match features of graphs of modeling functions to their real-world meaning. Students receive immediate feedback and have the opportunity to try questions repeatedly, watch a video or receive hints.
Math Graphs
Houghton Mifflin: Math Graphs: Interpreting a Graph 1 [Pdf]
Students identify or sketch quantities using a given graph. The resource consists of an enlarged printable version of a math graph available in PDF format.
Math Graphs
Houghton Mifflin: Math Graphs: Interpreting a Graph [Pdf]
Students use a given graph to identify and sketch different quantities. The math graph is available in PDF format.
Rice University
Rice University: Cynthia Lanius: Interpreting Graphs: The Hot Tub
The graph of the water level of a hot tub is presented and students are asked to tell the story of how the water level changes. Explanations of slope and functions accompany the problem.
Khan Academy
Khan: Lsn 8: Interpreting Relationships in Scatterplots/graphs/tables/equations
This lesson focuses on Interpreting and analyzing linear, quadratic, and exponential models and graphs. Students will use best fit lines to interpret contexts, distinguish whether contexts are linear or exponential functions, use the...
Texas A&M University
Wtamu Virtual Math Lab: Beginning Algebra: Reading Graphs
A good introduction to reading bar, line, and double line graphs, and drawing and reading Venn diagrams. Contains definitions and examples of these types of charts and graphs as well as practice exercises that ask you to answer questions...
Beacon Learning Center
Beacon Learning Center: Interpreting Line Graphs
This site is a lesson on creating and interpreting a line graph. It explains how a line graph is created and then asks questions about what is learned from the data. Students type in open responses, and answers and feedback follow.
National Council of Teachers of Mathematics
The Math Forum: Urban Systemic Initiative/oceans of Data
This site includes questions related to reading and understanding graphs. There are links on this site to lesson plans, benchmarks, and other webpages all of which mostly center about probability and statistics.
PBS
Pbs: Interpreting Stories and Graphs
This interactive exercise focuses on how line graphs can be used to represent mathematical data and provides an opportunity to translate actions from a story into graph form, then to write your own story to coincide with a line graph.
Other
Nearpod: Interpreting Slope & Y Intercept
For this lesson on interpreting slope and y-intercept, 8th graders will learn how to identify the slope and the y-intercept of a line in order to identify if a proportion is demonstrated.
Math Graphs
Houghton Mifflin: Math Graphs: Slope of a Tangent Line 1 [Pdf]
Students use the given graph to estimate the slope of a tangent line. The resource consists of an enlarged printable version of a math graph available in PDF format.
Math Graphs
Houghton Mifflin: Math Graphs: Slope of a Tangent Line 2 [Pdf]
Learners use the given graph to estimate the slope of a tangent line. The resource consists of an enlarged printable version of a math graph available in PDF format.
Math Graphs
Houghton Mifflin: Math Graphs: Slope of a Tangent Line 3 [Pdf]
Students use the given graph to estimate the slope of a tangent line. The resource consists of an enlarged printable version of a math graph available in PDF format.
Math Graphs
Houghton Mifflin: Math Graphs: Slope of a Tangent Line 4 [Pdf]
Students use the given graph to estimate the slope of a tangent line. The resource consists of an enlarged printable version of a math graph available in PDF format.
Math Graphs
Houghton Mifflin: Math Graphs: Slope of a Tangent Line 9 [Pdf]
Learners examine the concept of a slope related to differential calculus. The math graph is available in PDF format.
Math Graphs
Houghton Mifflin: Math Graphs: Slope of a Tangent Line 10 [Pdf]
Learners examine the concept of a slope related to differential calculus. The math graph is available in PDF format.
Math Graphs
Houghton Mifflin: Math Graphs: Average Rate of Change 1 [Pdf]
Students use the graph of "f" to determine the average rate of change and sketch a tangent line. The problem is available in PDF format.
E-learning for Kids
E Learning for Kids: Math: Movie Theater: Circle Graphs
On this interactive website, students practice interpreting information in circle graphs.

![Houghton Mifflin: Math Graphs: Interpreting a Graph 3 [Pdf] Unknown Type Houghton Mifflin: Math Graphs: Interpreting a Graph 3 [Pdf] Unknown Type](https://d15y2dacu3jp90.cloudfront.net/images/attachment_defaults/resource/large/FPO-knovation.png)


