Other
Vlps: Mean and Standard Deviation
Explanation of frequency distributions, mean, standard deviations, and variance including a Java Applet.
Thinkport Education
Thinkport: Algebra Ii: Standard Deviation
Begin by reviewing mean absolute deviation as a measure of variability. Your new learning will begin with standard deviation and understanding the difference between mean absolute deviation and standard deviation.
Google
Google for Education: Mean and Standard Deviation
This lesson demonstrates to learners how to use standard deviation to better understand a set of data. Students use standard deviation to determine the general pattern or shape of a given set of data to draw more reliable conclusions.
Wolfram Research
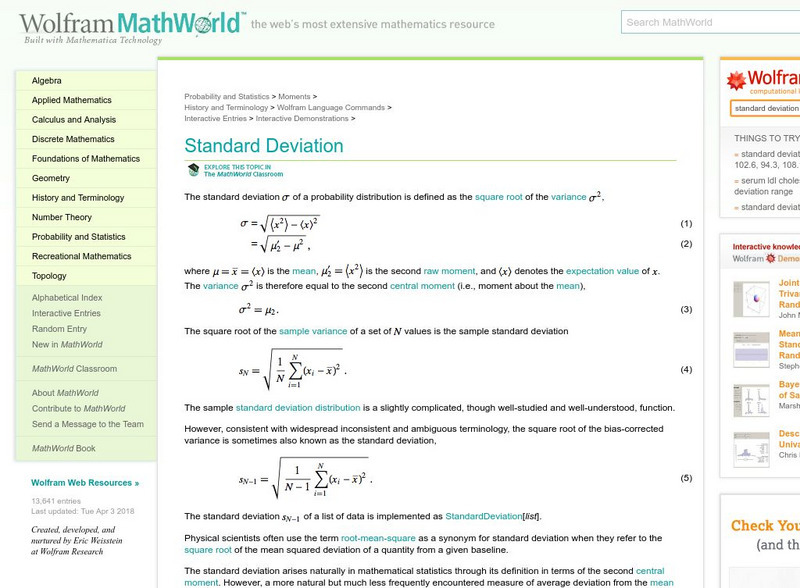
Wolfram Math World: Standard Deviation
This World of Mathematics site by Eric Weisstein explains the term "Standard deviation." Provides step-by-step help, examples, and charts.
Michigan Technological University
Computing Mean, Variance and Standard Deviation
Page centered around a computer program to determine mean, variance, and standard deviation.
Sophia Learning
Sophia: Standard Deviation
Students learn how to calculate the standard deviation by hand. Detailed examples that explore how to use the standard deviation formula are included.
Science Education Resource Center at Carleton College
Serc: Understanding the Standard Deviation: What Makes It Larger or Smaller?
Students develop a better intuitive understanding of what is meant by variability in statistics. Emphasis is placed on the standard deviation as a measure of variability.
CK-12 Foundation
Ck 12: Mean and Standard Deviation of Discrete Random Variables
[Free Registration/Login may be required to access all resource tools.] This Concept teaches students how to find the mean and standard deviation for discrete random variables.
Khan Academy
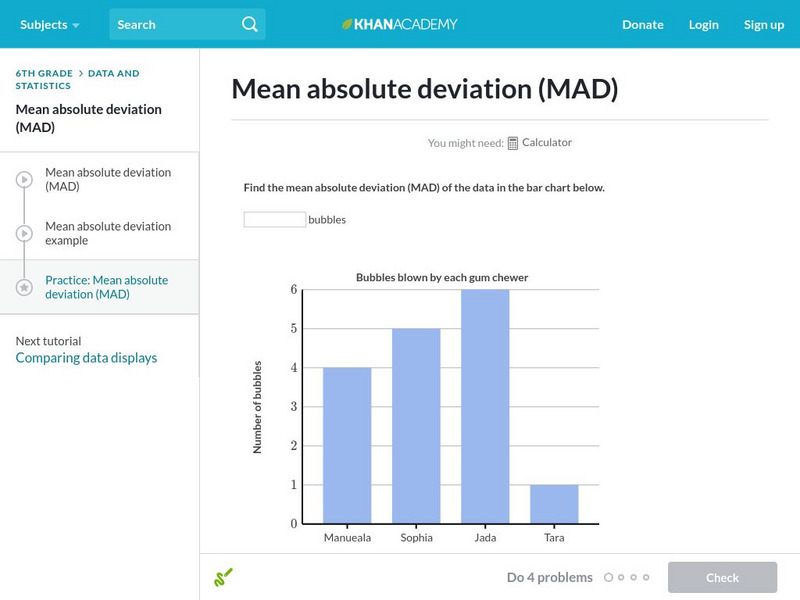
Khan Academy: Mean Absolute Deviation (Mad)
Practice calculating the mean absolute deviation.
Calculator Soup
Calculator Soup: Standard Deviation Calculator
Standard deviation is a statistical measure of diversity or variability in a data set. A low standard deviation indicates that data points are generally close to the mean or the average value. A high standard deviation indicates greater...
Stefan Warner and Steven R. Costenoble
Finite Mathematics & Applied Calculus: Mean, Median & Standard Deviation
Students learn about mean, median, variance, and standard deviation. The tutorial investigates the statistics concepts though class notes and examples. Review exercises are included.
Other
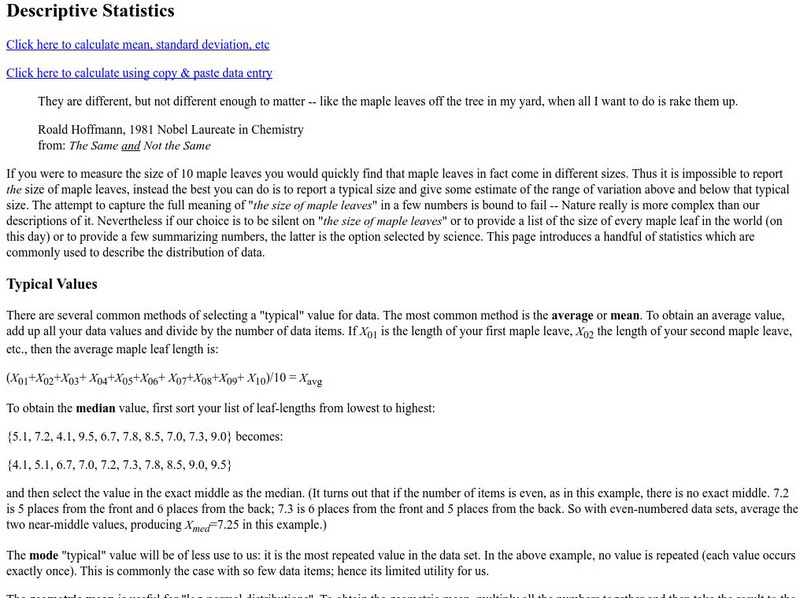
Descriptive Statistics
Very complete explanation of mean, standard deviation, etc. including an online calcluator for these statistics.
BBC
Bbc: Standard Deviation
A demonstration of how to find the standard deviation of a set of data. Several examples and a practice test are offered.
Vision Learning
Visionlearning: Statistics: Using Mean, Median, and Standard Deviation
An introduction to recognizing trends and relationships in data through descriptive statistics.
Illustrative Mathematics
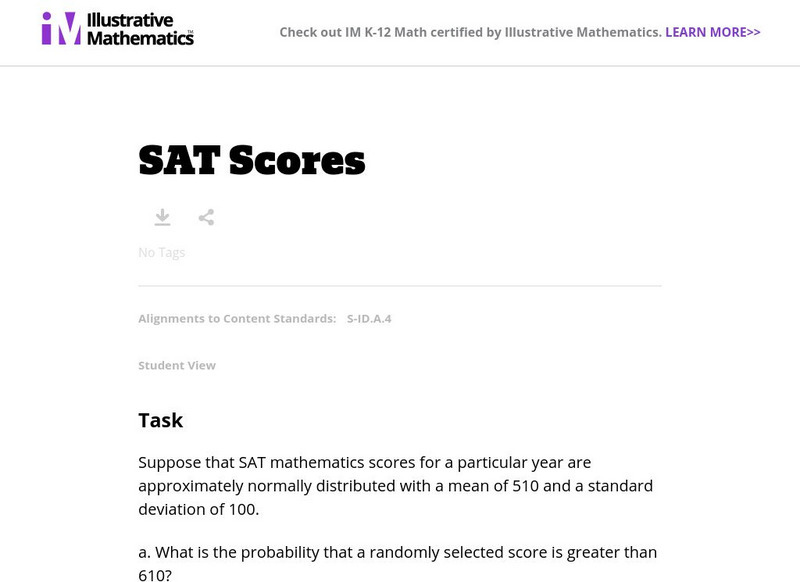
Illustrative Mathematics: S Id Sat Scores
Students will find solutions for a series of questions based on the assumption that SAT mathematics scores for a particular year are approximately normally distributed with a mean of 510 and a standard deviation of 100. Explanation and...
Illustrative Mathematics
Illustrative Mathematics: Measuring Variability in a Data Set
The purpose of this student task is to develop understanding of standard deviation. Aligns with S-ID.A.2 and S-ID.A.3.
Calculator Soup
Calculator Soup: Descriptive Statistics Calculator
This is a statistics calculator; enter a data set and hit calculate. Descriptive statistics summarize certain aspects of a data set or a population using numeric calculations. Examples of descriptive statistics include: mean, average,...
Texas Instruments
Texas Instruments: How Close Is Close?
In this activity, students compute statistical measures like the mean, standard deviation, and variance of the data set. They understand how measures of variability can be interpreted.
Texas Instruments
Texas Instruments: Simulation of Sampling Distributions
This set contains questions about simulating sampling distributions. Students see graphs of simulated distributions enabling them to reach conclusions about mean, shape, and standard deviation.
Texas Instruments
Texas Instruments: Probability as Relative Frequency
In this activity, students use simulation to justify the concept of the Law of Large Numbers. They understand that as the sample size increases, the relative frequency of which an event occurs approaches the probability of that event...
CK-12 Foundation
Ck 12: Algebra Ii: 5.5 Sampling Variability
This section explores the concept of sampling variability in the sample proportion. It will address the effect on the mean and standard deviation of a sample distribution as the sampling size changes.
Missouri State University
Missouri State University: Introductory Statistics: Statistics
This is an excellent resource on what the science of statistics involves. There are all kinds of definitions, examples, graphs, and charts to learn from. The topics covered include: mode, mean, median, skewed distributions and measures...
Missouri State University
Missouri State University: Introductory Statistics: The Normal Curve
Provides lengthy explanations of the measures of central tendencies - mean, mode, and median - and the measures of variability - range, variance, standard deviation - are given here. Graphs of interesting "side items" are presented as...
Missouri State University
Missouri State U.: Statistics: Measures of Central Tendency and Variability
Provides lengthy explanations of the measures of central tendency - mean, mode, and median - and the measures of variability - range, variance, standard deviation. Graphs of interesting examples are presented as well, skewed...

