American Psychological Association
Teaching Is Fundamental
It's important for teachers to have a strong support system—especially in the first few years of their career. Help teachers' partners, spouses, and friends understand the most compassionate ways to provide emotional support with a...
Khan Academy
Khan Academy: Normal Distributions Review
Normal distributions come up time and time again in statistics. A normal distribution has some interesting properties: it has a bell shape, the mean and median are equal, and 68% of the data falls within 1 standard deviation.
CK-12 Foundation
Ck 12: Algebra Ii: 5.3 Normal Distribution
This section explores normal distribution curves that have a unique, bell-like shape and represent data that is "normally" distributed. It also addresses how many real-life situations can be modeled by normal distribution curves.
CK-12 Foundation
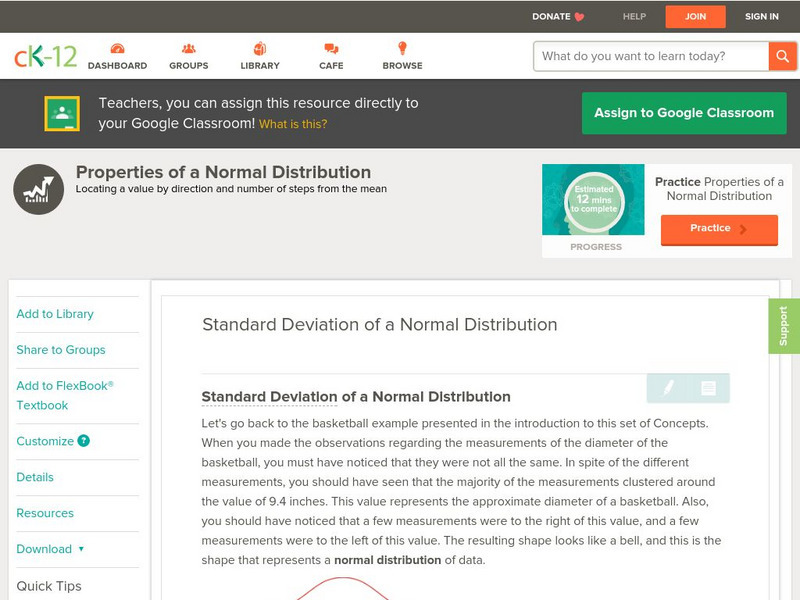
Ck 12: Statistics: Standard Deviation of a Normal Distribution
[Free Registration/Login may be required to access all resource tools.] Learn about the spread of a normal distribution.
Math Is Fun
Math Is Fun: Standard Normal Distribution Table
An explanation of standard normal distribution along with a table of values.
Missouri State University
Missouri State University: Introductory Statistics: The Normal Curve
Provides a complete discussion of normal curves in statistics. Site is presented in notes with examples added as needed.
Other
West Virginia University: Normal Distribution
The history of the normal curve and its use in statistics is presented. An Applet is provided for the user to adjust the left and right edges of the probability and see the effect on the area under the curve.
Texas Instruments
Texas Instruments: The Normal Distribution
In this activity, students will apply the normal density function, normal cumulative distribution function, and inverse normal cumulative function to analyze a population with a normal distribution.
Texas Instruments
Texas Instruments: Normal Distribution
This set contains statistics questions regarding the normal curve, its distribution, and its applications. The student, using the correct calculation, transitions between observed x-values, standard z-scores, and normal curve areas.
Texas Instruments
Texas Instruments: The Normal Distribution
Students graph normal distributions, shade desired areas, and find related probabilities. They graph Normal probability scatter plots to check the normal (linear) shape of a data distribution.
Texas Instruments
Texas Instruments: Plums and the Normal Distribution
This lesson demonstrates how the calculator's built-in numeric solver can be used along with the normalcdf function to answer a variety of Normal Distribution questions.
Texas Instruments
Texas Instruments: Special Cases of Normally Distributed Data
Students perform single and two-sample t procedures to investigate special cases of normally distributed data. They explore inference for a least-square regression line, including the confidence interval.
Shodor Education Foundation
Shodor Interactivate: Normal Distribution
Change the standard deviation of an automatically generated normal distribution to create a new histogram. Observe how well the histogram fits the curve, and how areas under the curve correspond to the number of trials.
CK-12 Foundation
Ck 12: Statistics: Normal Distributions Advanced
[Free Registration/Login may be required to access all resource tools.] This concept introduces students to the standard normal probability distribution.
CK-12 Foundation
Ck 12: Statistics: Applications of Normal Distributions
[Free Registration/Login may be required to access all resource tools.] This Concept introduces students to applications of the Normal Distribution.
CK-12 Foundation
Ck 12: Statistics: Normal Distributions
[Free Registration/Login may be required to access all resource tools.] Determine if a data set approximates a normal distribution.
Math Planet
Math Planet: Algebra 2: Standard Deviation and Normal Distribution
Gain an understanding of standard deviation and normal distribution by viewing an example and a video lesson.
Khan Academy
Khan Academy: Normal Distribution of Random Numbers
Using the Random object in JavaScript, a normal distribution of random numbers is created.
CK-12 Foundation
Ck 12: Statistics: Density Curve of the Normal Distribution
[Free Registration/Login may be required to access all resource tools.] This Concept expands upon the previous by discussing further the normal distribution and the probabilities associated with it by looking at the normal density curve.
Missouri State University
Missouri State University: Introductory Statistics: The Normal Curve
Provides lengthy explanations of the measures of central tendencies - mean, mode, and median - and the measures of variability - range, variance, standard deviation - are given here. Graphs of interesting "side items" are presented as...
Interactive Mathematics
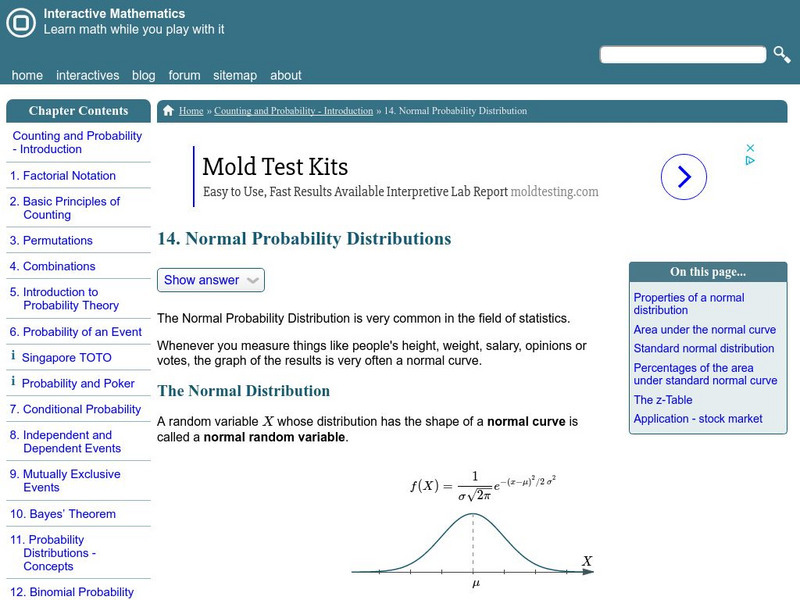
Interactive Mathematics: The Normal Distribution
Formulas and properties of the normal distribution are presented, including details on the normal random variable and the standard normal distribution. Several real world examples are also included with detailed solutions.
Palomar Community College District
Palomar College: The Normal Curve an Example
A collection of step-by-step worked problems demonstrating how to take a normal curve and determine the probability (area) under it. Hints are provided along the way and the final measures are shown for the user to check.
Other
Fayetteville State University: Z Distributions
The introductory paragraph explains Z-Distributions, their spread, and the ability to find certain values within the distribution. Two animated graphs are then provided as an example of the probability of the normal distribution curve.
Khan Academy
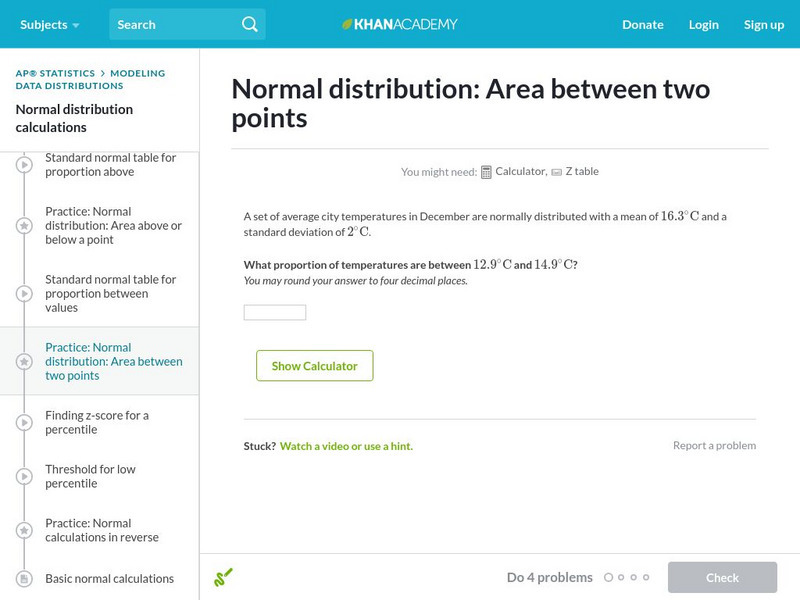
Khan Academy: Normal Distribution: Area Between Two Points
Use a z-table to find the probability that a particular measurement is in a range. Students receive immediate feedback and have the opportunity to try questions repeatedly, watch a video or receive hints.


