Khan Academy
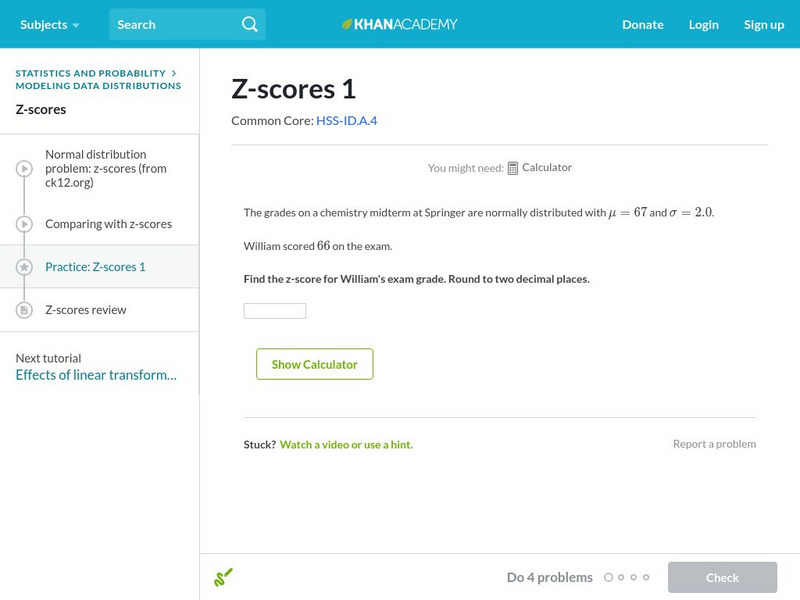
Khan Academy: Z Scores 1
Find the z-score of a particular measurement given the mean and standard deviation. Students receive immediate feedback and have the opportunity to try questions repeatedly, watch a video or receive hints.
Texas Education Agency
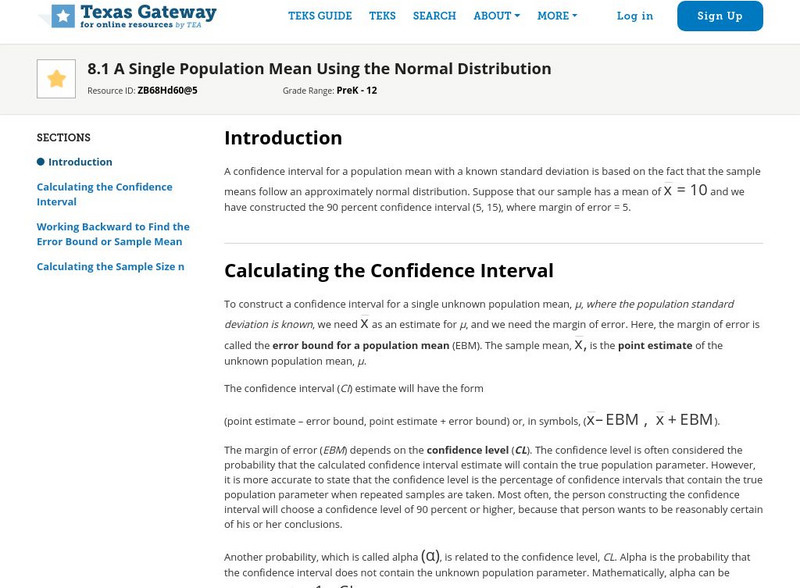
Texas Gateway: A Single Population Mean Using the Normal Distribution
This lesson explains how to calculate and interpret the confidence interval for a population mean. It also looks at the effect on the confidence interval of changing the confidence level or sample size. It then explains how to find the...
CK-12 Foundation
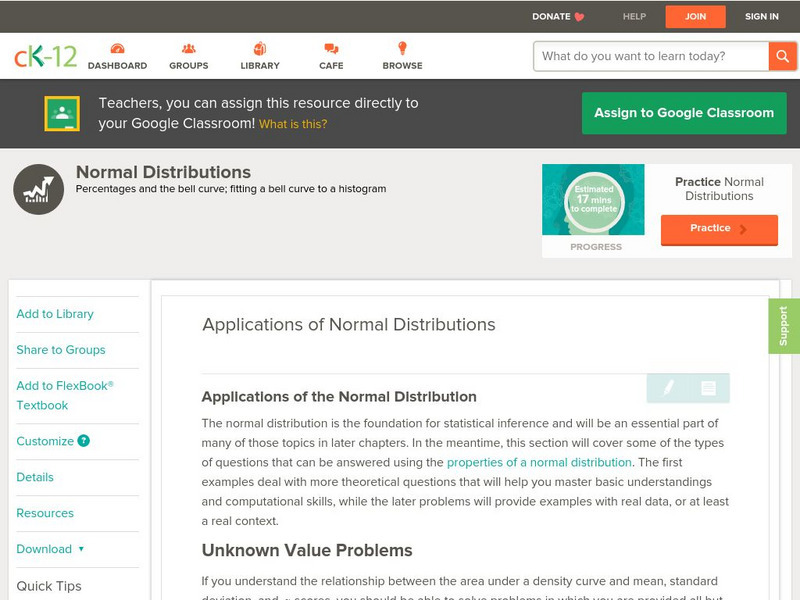
Ck 12: Statistics: Applications of Normal Distributions
[Free Registration/Login may be required to access all resource tools.] This Concept introduces students to applications of the Normal Distribution.
Texas Instruments
Texas Instruments: Normal Distribution
This set contains statistics questions regarding the normal curve, its distribution, and its applications. The student, using the correct calculation, transitions between observed x-values, standard z-scores, and normal curve areas.
Other
Fayetteville State University: Z Distributions
The introductory paragraph explains Z-Distributions, their spread, and the ability to find certain values within the distribution. Two animated graphs are then provided as an example of the probability of the normal distribution curve.
Khan Academy
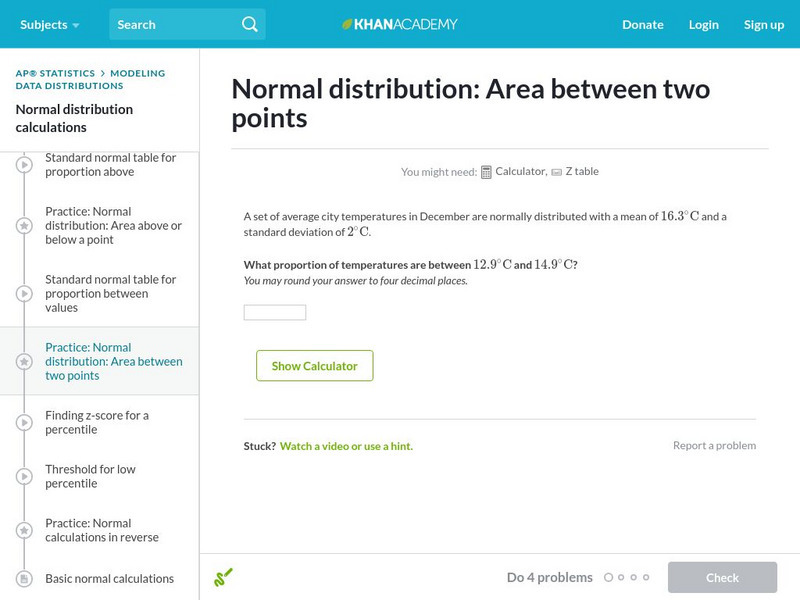
Khan Academy: Normal Distribution: Area Between Two Points
Use a z-table to find the probability that a particular measurement is in a range. Students receive immediate feedback and have the opportunity to try questions repeatedly, watch a video or receive hints.
Khan Academy
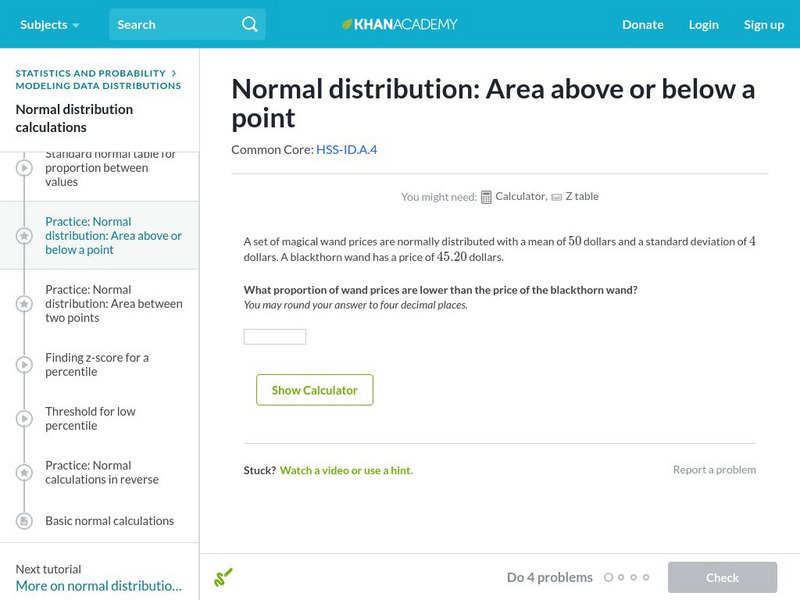
Khan Academy: Normal Distribution: Area Above or Below a Point
Use a z-table to find the probability of a particular measurement. Students receive immediate feedback and have the opportunity to try questions repeatedly, watch a video or receive hints.
Other
Magoosh: Statistics Fundamentals
An online course on the fundamentals of statistics including video lessons in Mean, Median, and Mode; Weighted Averages; Quartiles and Boxplots; Range and Standard Deviation; Normal Distribution; Z-scores; Intro to Inferential...
Other
Fayetteville State University: Z Scores and Probability
Several paragraphs of explanation and graphs are found here to get across the concept of normal scores, z-scores, and the related probability in a simple fashion. This page is part of a collection from the university on basic statistical...
Texas Instruments
Texas Instruments: Numb3 Rs: Choosing Contenders
Based off of the hit television show NUMB3RS, this lesson shows students two different ways to "normalize" scores: by applying a created scalar factor so that all scores have a mean of one, or by using z-scores. Students are walked...
Sophia Learning
Sophia: Practical Applications of the Bell Shaped Curve
Explore the bell-shaped curve and how to calculate a z score. Additional links provided to further knowledge on outliers.
CK-12 Foundation
Ck 12: Statistics: Central Limit Theorem
[Free Registration/Login may be required to access all resource tools.] Introduces students to the Central Limit Theorem. Students will learn about the Central Limit Theorem and calculate a sampling distribution using the mean and...
University of Colorado
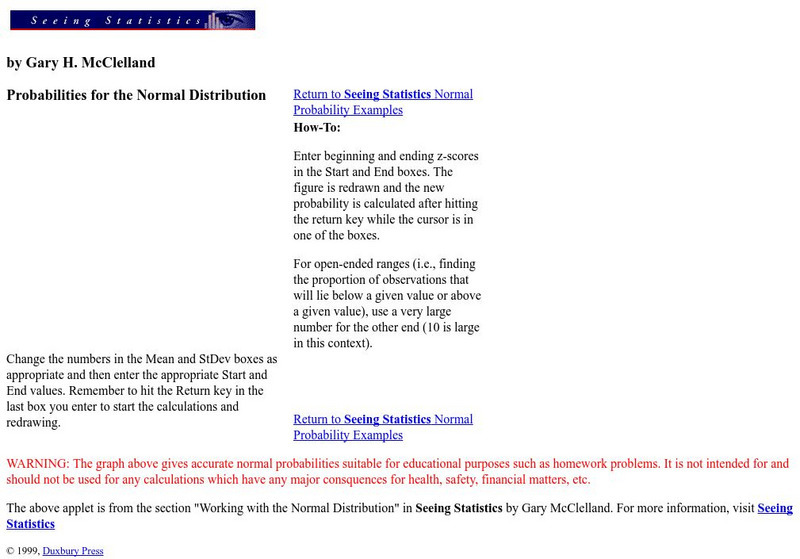
University of Colorado: Normal Probabilities Applet #1
This Applet will assist the user in questions which specify a range of raw scores or z-scores and ask for a probability associated with them.
Oswego City School District
Regents Exam Prep Center: Binomial Probability
The mathematics tutorial investigates binomial probability and the normal curve. The lesson consists of class notes, calculator tips, examples, and practice problems with solutions. The teacher resource includes a z-score chart.
