College Board
AP® Psychology: Teaching Statistics and Research Methodology
Psychologists use statistics? Scholars investigate the research behind the methodology of statistical analysis. Using hands-on practice, case-studies, and scatterplots, they complete various tasks to understand the very roots of high...
Annenberg Foundation
Annenberg Learner: Against All Odds: Inside Statistics: Correlation
Twin studies track how similar identical and fraternal twins are on various characteristics, even if they don't grow up together. Correlation lets researchers put a number on it. Scroll down the page to find comprehensive student and...
Varsity Tutors
Varsity Tutors: Hotmath: Practice Problems: Correlation and Lines of Best Fit
Twenty problems present a variety of practice determining correlation based on data in a scatter plot and using lines of best fit with given data. They are given with each step to the solution cleverly revealed one at a time. You can...
PBS
Pbs Learning Media: How to Use Correlative Conjunctions
Either, nor? Or, neither? Neither! You use correlative conjunctions in connecting two equal grammatical items. If a noun follows "either," then a noun will also follow "or." If a noun follows "neither," then a noun will also follow...
Texas Instruments
Texas Instruments: Scatterplots and Correlation With Ti 89
Students input data relating the values of one variable associated with values of another and use these data to generate a scatterplot. From the scatterplot, they determine whether there is a correlation between the two variables and...
Shodor Education Foundation
Shodor Interactivate: Linear Regression and Correlation
Students are introduced to correlation between two variables and the line of best fit.
Texas Instruments
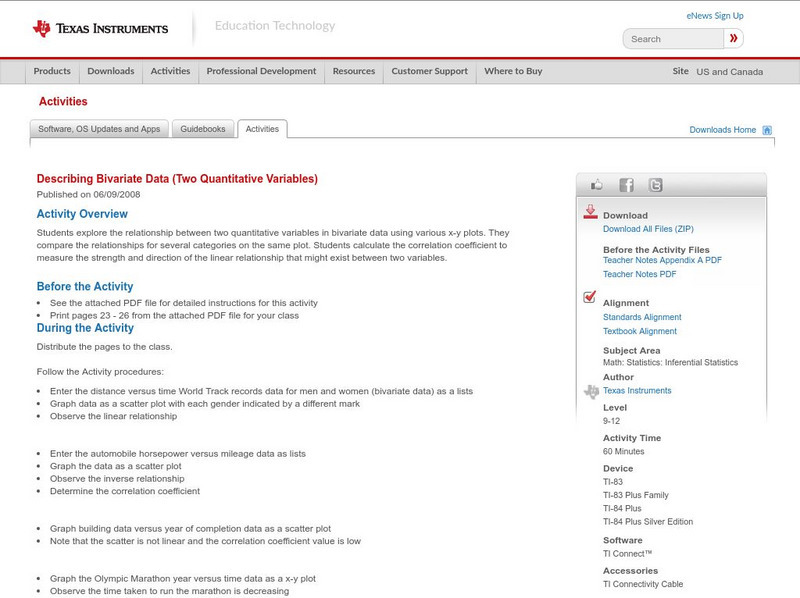
Texas Instruments: Describing Bivariate Data (Two Quantitative Variables)
Students explore the relationship between two quantitative variables in bivariate data using various x-y plots. They compare the relationships for several categories on the same plot. Students calculate the correlation coefficient to...
Science Education Resource Center at Carleton College
Serc: The Evolution of Pearson's Correlation Coefficient
For this activity, students explore nine scatter plots to develop their understanding of how two quantitative variables are related. Through an exploration of the properties of this association, they come to understand the standard...
CK-12 Foundation
Ck 12: Statistics: Rank Sum Test and Rank Correlation
[Free Registration/Login may be required to access all resource tools.] This Concept introduces students to the rank sum test and rank correlation for two non-paired samples.
Khan Academy
Khan Academy: Scatterplots and Correlation Review
A scatterplot is a type of data display that shows the relationship between two numerical variables. Each member of the dataset gets plotted as a point whose x-y coordinates relates to its values for the two variables.
Texas Instruments
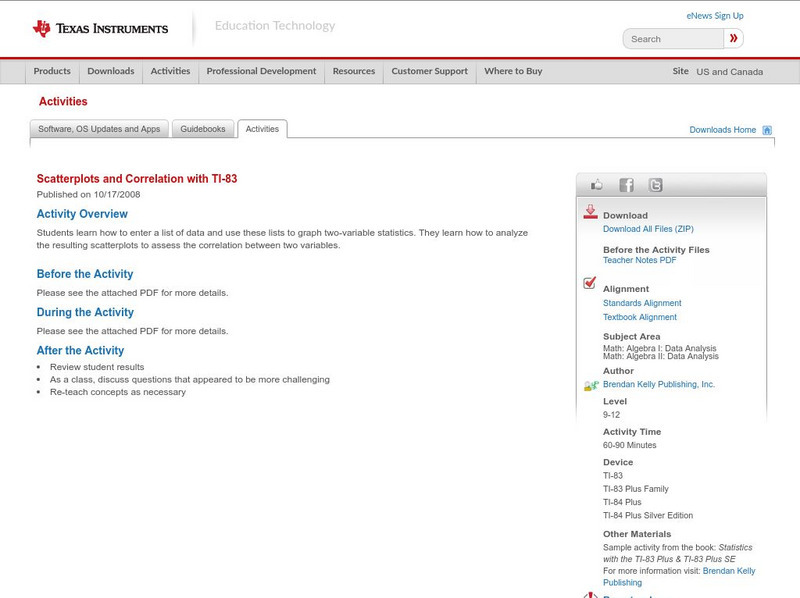
Texas Instruments: Scatterplots and Correlation With Ti 83
Students learn how to enter a list of data and use these lists to graph two-variable statistics. They learn how to analyze the resulting scatterplots to assess the correlation between two variables.
Other
California Department of Education: Cahsee Math: Number Sense for Teachers [Pdf]
Although part of the Teacher's Study Guide for the CAHSEE, this section of the document focuses on number sense. In this guide, teachers are shown sample questions correlated to state standards, given an explanation of the worthiness of...
University of Glasgow
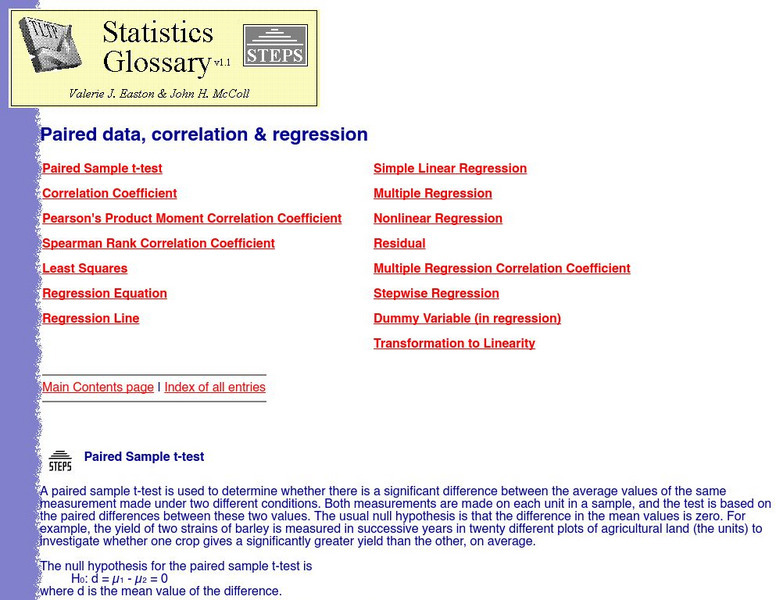
University of Glasgow: Steps Statistics Glossary: Correlation Coefficient
Overview of correlation coefficient, or a number between 1 and -1 which measures the degree to which two variables are linearly related. It is followed by a description of the Pearson product moment correlation coefficient.
University of Glasgow
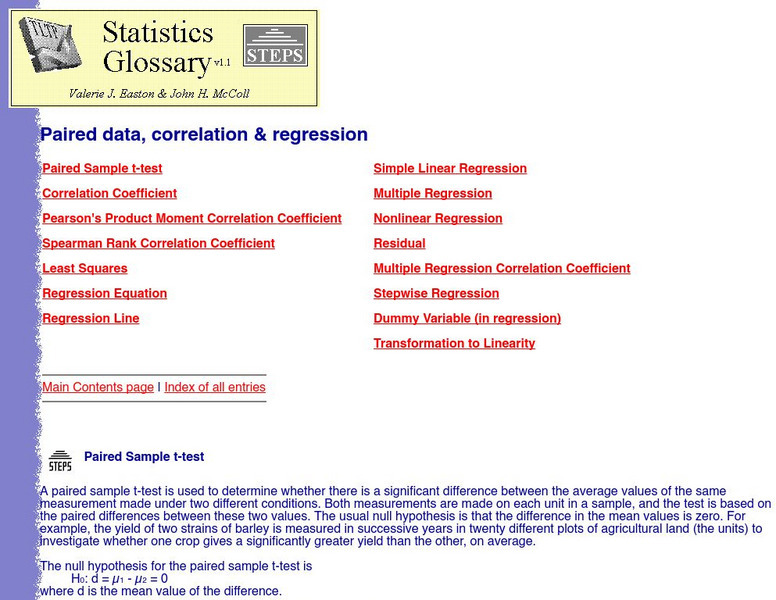
Steps: Pearson's Product Moment Correlation Coefficient
Overview of Pearson's Product Moment Correlation Coefficient, which is just one example of a correlation coefficient.
National Council of Teachers of Mathematics
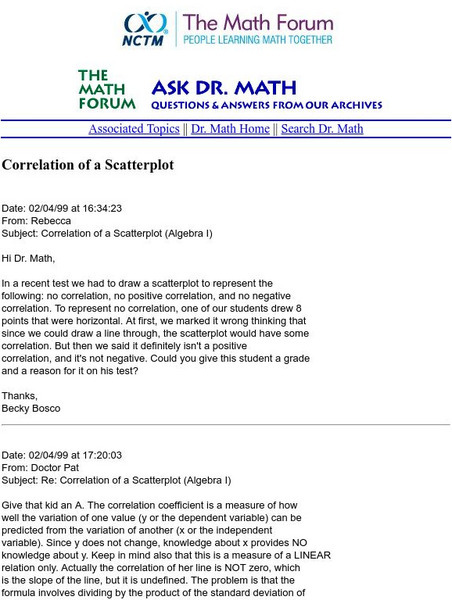
The Math Forum: Nctm: Ask Dr. Math: Correlation of a Scatterplot
This page from Ask Dr. Math describes the correlation of a scatterplot and gives an example of one with no correlation.
ClassFlow
Class Flow: Two Bad Ants
[Free Registration/Login Required] This flipchart correlates with the Scott Foresman Grade 3 textbook. It preteaches the main comprehension skill which is recognizing the aspects of the literary genres realism vs. fantasy; has...
Ministry of Education and Universities of the Region of Murcia (Spain)
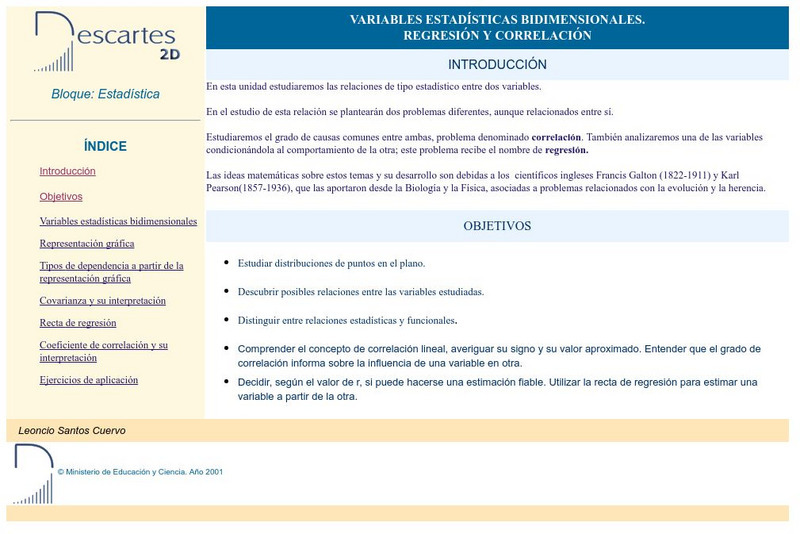
Ministerio De Educacion Y Ciencia: Variable Estadisticas Bidimensionales
In Spanish. This interactive unit shows you the statistical relationship between two variables.
Colby College
Spanish Language & Culture: Preterite and Imperfect (Part 2)
Great exercise for practicing the preterite and imperfect tenses. Provide the correct form of verb infinitives that complete the story of Goldilocks and the Three Bears. Immediate feedback corrects the answer. Correlates to another...
Other
University of Waikato: Science Learning Hub: Absolute Dating
Explains what absolute dating is as compared to relative dating and how they can work together. The characteristics of several different radiometric methods are compared. Includes three short videos and an interactive where students...
Sophia Learning
Sophia: Conjunctions: An Introduction
This slideshow lesson focuses on conjunctions; it defines conjunctions. It explains each of the three types of conjunctions: coordinating, subordinating, and correlative. It defines each, lists the conjunctions, and provides sentences...
ClassFlow
Class Flow: Two Sounds of G
[Free Registration/Login Required] This flipchart is correlated to Houghton Mifflin Grade 2 reading series. It reviews words with soft and hard g sounds, and includes a song, sound clips, interactive sorting, and classifying, spelling...
Alabama Learning Exchange
Alex: The Path to Positive
Using the story Less than Zero by Stuart Murphy, young scholars relate money matters to positive and negative numbers as a real-life correlation. Incorporated into this lesson, students play the path to positive game where they are...
Illustrative Mathematics
Illustrative Mathematics: S Id Golf and Divorce
This is a simple task addressing the distinction between correlation and causation. Young scholars are given information indicating a correlation between two variables and are asked to reason out whether or not a causation can be inferred.
Texas Instruments
Texas Instruments: Numb3 Rs: "Take Out" Outliers
Based off of the hit television show NUMB3RS, this lesson has students create box-and-whisker plots for given data, and then determine which (if any) data points are outliers. Students determine outliers through two methods in this...


