Khan Academy
Khan Academy: Make Line Plots
Practice creating line plots (dot plots) from data sets. Students receive immediate feedback and have the opportunity to try questions repeatedly, watch a tutorial video, or receive hints.
Khan Academy
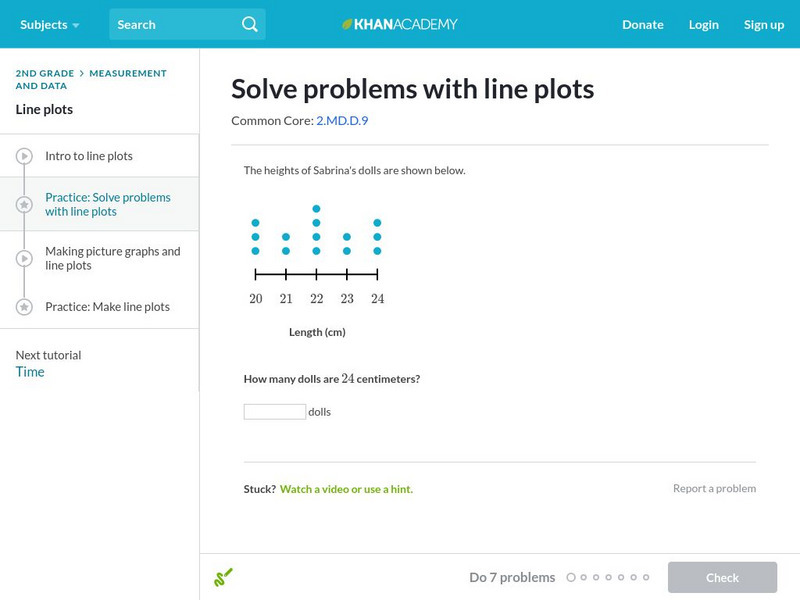
Khan Academy: Solve Problems With Line Plots
Answer questions using line plots and data sets. Students receive immediate feedback and have the opportunity to try questions repeatedly, watch a tutorial video, or receive hints.
Math Is Fun
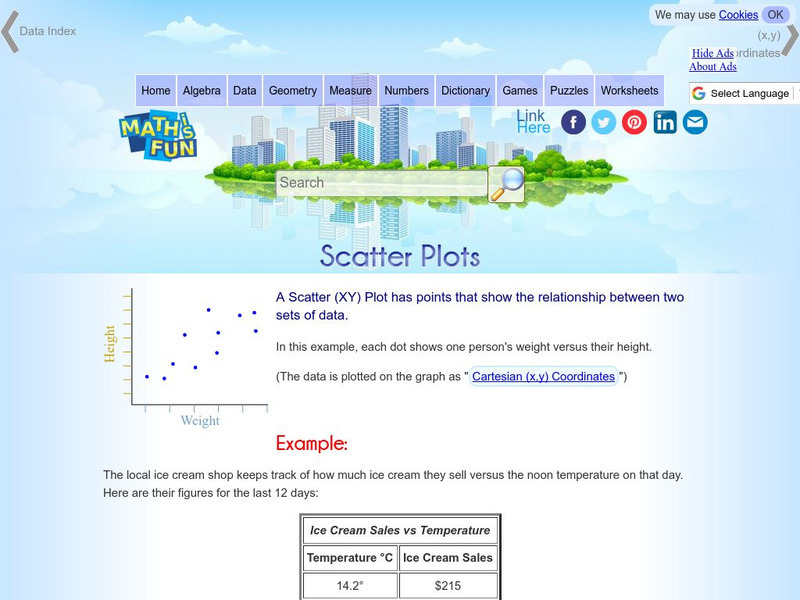
Math Is Fun: Scatter Plots
Explains, with examples, what scatter plots are and how to interpret the data. Discusses trends, interpolation and extrapolation, and correlation. Includes a set of practice questions.
Khan Academy
Khan Academy: Creating Dot Plots
Practice creating dot plots. Dot plots are very similar to frequency tables, but they make it easier to see the data. Students receive immediate feedback and have the opportunity to try questions repeatedly, watch a video or receive hints.
McGraw Hill
Glencoe: Self Check Quizzes 2 Line Plots
Use Glencoe's Math Course 2 randomly generated self-checking quiz to test your knowledge of line plots. Each question has a "Hint" link to help. Choose the correct answer for each problem. At the bottom of the page click the "Check It"...
CPALMS
Cpalms: Measure Up! Measuring to Make a Line Plot
[Free Registration/Login Required] In this lesson, students will generate measurement data by measuring lengths using rulers marked with halves and fourths of an inch and show the data by making a line plot. This lesson includes an...
Texas Instruments
Texas Instruments: An Olympic Plot
In this activity, students find lines of best fit to model Olympic data.
Oswego City School District
Regents Exam Prep Center: Scatter Plots and Line of Best Fit
Use this lesson, practice exercise, and teacher resource in planning instruction on scatter plots and line of best fit. In the lessons, you'll find definitions and examples of ways to make a scatter plot, determine correlations, and find...
Scholastic
Scholastic: Study Jams! Math: Data Analysis: Line Plots
Explore how to organize and plot data on a line plot by going step by step through the activity. Then test your knowledge to check for understanding.
Annenberg Foundation
Annenberg Learner: Creating a Line Plot
Watch as a physical stack of coins is added as a series of dots to a line plot.
Khan Academy
Khan Academy: Practice: Make Line Plots
A practice quiz where students construct line plots using the information given in the problems. Includes hints.
Quia
Ixl Learning: Line Plots
Brush up on your math skills relating to line plots then try some practice problems to test your understanding.
Quia
Ixl Learning: Dot Plots
Brush up on your math skills relating to dot plots then try some practice problems to test your understanding.
Annenberg Foundation
Annenberg Learner: Making a Stem and Leaf Plot
A line plot may not be a useful graph for investigating variation so we must come up with a new representation based on groups of data. Construct a stem and leaf plot from a set of 26 data values.
Cuemath
Cuemath: Line Graphs
A comprehensive guide for learning all about line graphs with definitions, their sections, how to read and create graphs, solved examples, and practice questions.
Khan Academy
Khan Academy: Read Line Plots (Data With Fractions)
Practice reading and interpreting data that is graphed on line plots. The data graphed includes fractions. Students receive immediate feedback and have the opportunity to try questions repeatedly, watch a video or receive hints....
Other
National Security Agency: Line Plots: Frogs in Flight [Pdf]
Students learn how to construct and interpret line plots. The lesson plan describes an activity that has students collect data, create line plots, and interpret and analyze the data.
Khan Academy
Khan Academy: Line Plots Review
Reviews what line plots are and how to make them. Includes some practice problems with explanations of the solutions.
CK-12 Foundation
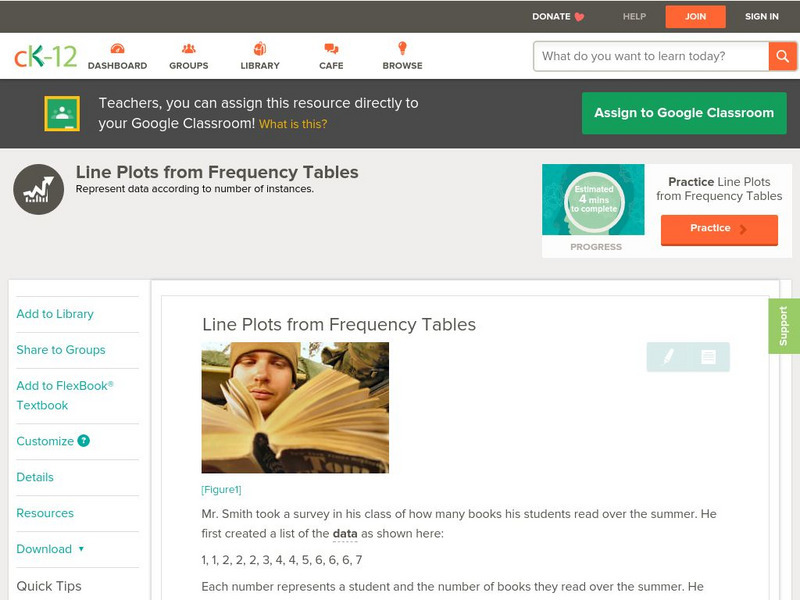
Ck 12: Statistics: Line Plots From Frequency Tables
[Free Registration/Login may be required to access all resource tools.] Create a line plot given data organized in a frequency table.
Khan Academy
Khan Academy: Eyeballing the Line of Best Fit
Students practice informally graphing a line of best fit to a scatter plot and answer questions to determine if a scatter plot has a correlation. Students receive immediate feedback and have the opportunity to watch a video, get hints,...
Math Planet
Math Planet: Stem and Leaf Plots and Box and Whiskers Plot
Discover how to use stem-and-leaf plots and box-and-whisker plots to visualize data by taking a look at examples and a video lesson.
Khan Academy
Khan Academy: Estimating Equations of Lines of Best Fit and Making Predictions
Practice estimating the equation of a line of best fit through data points in a scatter plot. Then use the equation to make a prediction. Students receive immediate feedback and have the opportunity to try questions repeatedly, watch a...
Khan Academy
Khan Academy: Creating Box Plots
More practice making box plots to summarize data sets. Students receive immediate feedback and have the opportunity to try questions repeatedly, watch a video or receive hints.
CK-12 Foundation
Ck 12: Algebra: Fitting Lines to Data
[Free Registration/Login may be required to access all resource tools.] Make a scatter plot of data and find the line of best fit to represent that data.
Other popular searches
- Line Plot Worksheets
- Line Plot
- Line Plot Graphs
- 1st Grade Line Plot
- Free Line Plot
- Line Plot Pictures
- Frequency Table Line Plot
- Scatter Plot Trend Line
- Line Plot Outliers
- Fraction Line Plot
- Math Line Plot
- Free Line Plot Worksheets


![National Security Agency: Line Plots: Frogs in Flight [Pdf] Lesson Plan National Security Agency: Line Plots: Frogs in Flight [Pdf] Lesson Plan](https://content.lessonplanet.com/knovation/original/122495-587001a487c71ef32e76fdab66ff794e.jpg?1661494304)


