Association of Religion Data Archives
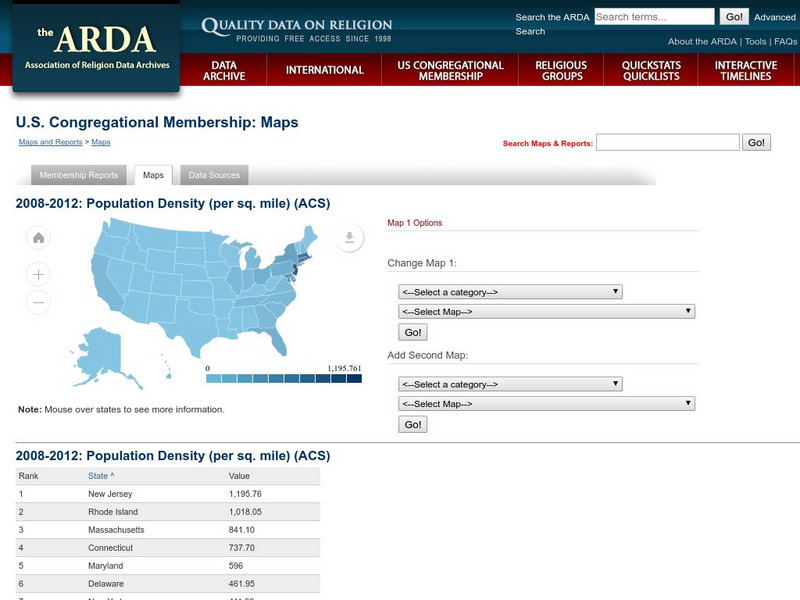
Association of Religion Data Archives: u.s. Population Density Map
Interactive tool that lets you choose a map (Census or Religion), then choose demographic or religious profiles to create a slideshow.
National Geographic
National Geographic: Population Density in the United States
Several factors contribute to the population trends across the United States. This lesson will explore maps to discover and understand these trends.
Geographypods
Geographypods: Theme 1: Population and Settlement
A rich collection of highly engaging learning modules on topics related to population and settlement. Covers six main areas - population growth, population change, population migration, land use, settlement characteristics and patterns,...
Other
Canada: Thematic Maps
At this site find examples of thematic maps from the Canadian census. "A thematic map shows the spatial distribution of one or more specific data themes for standard geographic areas."
Curated OER
Etc: Maps Etc: Population Distributions in Africa, 1920
A map from 1920 of Africa and Madagascar showing the population distribution in the region, keyed to show densities ranging from under 2 persons per square mile to over 250 persons per square mile.
Curated OER
Etc: Maps Etc: Population Distributions in Asia , 1920
A map from 1920 showing the population distributions in Asia.
Columbia University
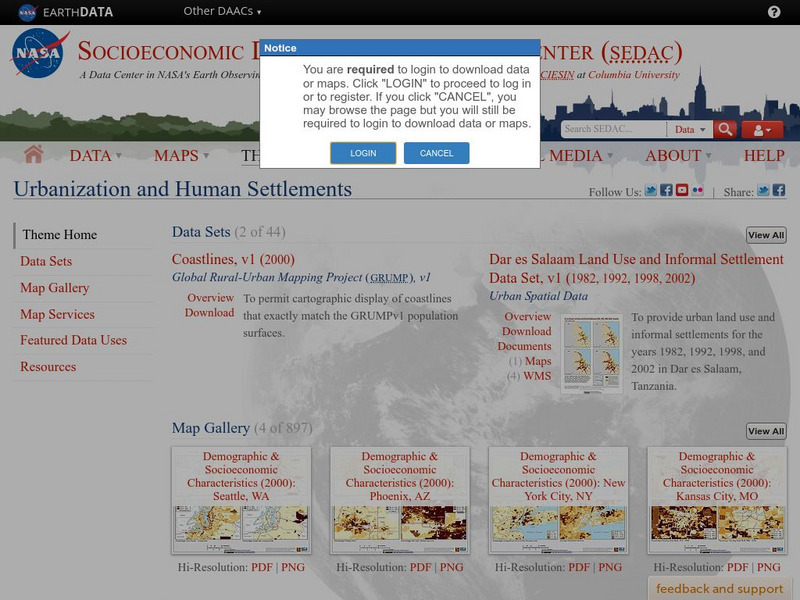
Nasa: Sedac: Urbanization and Human Settlements
[Free Registration/Login Required] A collection of twenty data sets from SEDAC (Socioeconomic Data and Applications Center) that examine urbanization in major metropolitan areas of the United States in the late 20th and the early 21st...
Curated OER
Etc: Maps Etc: Population Distribution of China, 1971
A map from 1971 showing comparative population distribution patterns of China and the United States. The map illustrates the terrain barriers to population development in China, and the trend to dense populations along the coast and...
Curated OER
Etc: Maps Etc: Population Distribution of North America, 1916
A map from 1916 of North America, Central America, Greenland, and the Caribbean to Puerto Rico showing the population distribution at the time. The map is color-coded to show areas where the population density ranges from under 1...
Curated OER
Etc: Maps Etc: Population Distribution of Asia, 1921
A base map of Asia from 1921 showing the general population distribution of the region at the time. "The climate of southeastern Asia is so warm and moist that food plants grow there in abundance. Nearly half the people of the world live...
Curated OER
Etc: Maps Etc: Population Distribution of North America, 1921
A base map from 1921 of North America, Central America, and the Caribbean showing the general population distribution in Alaska, Greenland, Dominion of Canada, United States, Mexico, and Central America at the time. People are most...
Curated OER
Educational Technology Clearinghouse: Maps Etc: Population Distribution, 1870
A map from 1907 of the United States showing the distribution of the population in 1870. The map is keyed to show areas of population with densities ranging from under 2 inhabitants per square mile to 90 and over inhabitants per square...
Curated OER
Educational Technology Clearinghouse: Maps Etc: Population Distribution, 1860
A map of the central and eastern United States in 1860 showing the distribution of the population in the region at the time. The map shows State lines, the frontier line in 1860, and is keyed to show the areas of population density...
Curated OER
Etc: Maps Etc: Distribution of Population , 1850
A map of the United States showing the population distribution in 1850. The map is coded to show population densities ranging from under 2 inhabitants per square mile to over 90 inhabitants per square mile. The map illustrates the...
Curated OER
Etc: Maps Etc: Density of Population in the u.s., 1901
A map from 1901 of the United States showing the population distribution at the time. The map is keyed to show areas of population densities ranging from sparse to very dense. This map is part of a classroom map study illustrating how,...
Curated OER
Educational Technology Clearinghouse: Maps Etc: North America, Population, 1911
A map from 1911 of North America, Central America, Greenland, and the Caribbean to Puerto Rico showing the population distribution at the time. The map is color-coded to show population densities from under 2 persons per square mile to...
Curated OER
Etc: Maps Etc: Population of North America, 1898
A map from 1898 showing the population distribution of North America, Central America, and Caribbean to Puerto Rico. The map shows areas of sparse to heavily populated concentrations at the time. "Many thousands of white men from western...
Curated OER
Educational Technology Clearinghouse: Maps Etc: Distribution of Population, 1820
A population map of United States and territories in 1820 showing the distribution of the European-American population at the time and the general tribal lands of the Native Americans east of the Mississippi River. The map shows the...
Curated OER
Educational Technology Clearinghouse: Maps Etc: Distribution of Population, 1830
A population map of United States and territories in 1830 showing the distribution of the European-American population at the time and the general tribal lands of the Native Americans east of the Mississippi River. The map shows the...
Curated OER
Educational Technology Clearinghouse: Maps Etc: Distribution of Population, 1880
A map of the United States showing the distribution of the population in 1880. The map is keyed to show areas of population with densities ranging from under 2 inhabitants per square mile to 90 and over inhabitants per square mile.
Curated OER
Educational Technology Clearinghouse: Maps Etc: Distribution of Population, 1790
A map of the original thirteen States in 1790 showing State lines, territories northwest and south of the Ohio River, British and Spanish possessions, and the distribution of the European-American population east of the Mississippi River...
Curated OER
Educational Technology Clearinghouse: Maps Etc: American Population, 1790
A map of the original thirteen States in 1790 showing the distribution of the European-American population at the time and the general tribal lands of the Native Americans east of the Mississippi River. The map shows the State lines,...
Curated OER
Educational Technology Clearinghouse: Maps Etc: Population, 1840
A map of the central and eastern United States in 1840 showing the distribution of the population in the region at the time. The map shows State lines, the frontier line in 1840, and is keyed to show the areas of population density...


