Hi, what do you want to do?
Math Drills
Math Drills: Statistics and Probability Worksheets
Download these free worksheets to sharpen your skills with statistics and probability. Sheets focus on collecting and organizing data, measures of central tendency (mean, median, mode, and range), and probability.
Other
Stat Trek: Data Patterns in Statistics
This lesson looks at how to recognize patterns in a data display by examining the shape of a graph, the center, the spread, and unusual features such as outliers. Includes video. [11:16]
E-learning for Kids
E Learning for Kids: Math: Dinosaurs: Data and Chance
Students can play learning games to explore how to label, read, and create graphs using a dinosaur theme.
E-learning for Kids
E Learning for Kids: Math: Music / Dance Performance: Data and Chance Experiments
On this interactive site students use the setting of a dance performance to predict all possible outcomes and make vertical and horizontal bar graphs.
CK-12 Foundation
Ck 12: Algebra: Fitting Lines to Data
[Free Registration/Login may be required to access all resource tools.] Make a scatter plot of data and find the line of best fit to represent that data.
National Council of Teachers of Mathematics
Nctm: Illuminations: Advanced Data Grapher
The Advanced Data Grapher can be used to analyze data with box plots, bubble graphs, scatterplots, histograms, and stem-and-leaf plots.
E-learning for Kids
E Learning for Kids: Math: Music, Dance Performance: Chance & Data
Nadir and his family play in a band. Can you help him get all the instruments together? In these activities, students will write data using symbols, use one object to represent one item, create a column graph, and determine whether...
E-learning for Kids
E Learning for Kids: Math: Carnival Parade in Rio: Chance & Data
Help Louis during the Carnival with graphs and chances.
Annenberg Foundation
Annenberg Learner: Making a Stem and Leaf Plot
A line plot may not be a useful graph for investigating variation so we must come up with a new representation based on groups of data. Construct a stem and leaf plot from a set of 26 data values.
Other
42e Xplore: Statistics and Probability
An extensive collection of links on statistics and probability can be found here! Discussions ranging from the basics of stats through more complex data analysis. Topics are broken down into sections for teachers, students, WebQuest...
PBS
Pbs Lesson Plan: Chances Are Talking Probability (Pdf) [Pdf]
An introductory lesson in probability for students in grades three to five. The concepts presented in this lesson are interwoven, over time, into a current unit of study. Students examine closely the "language" of probability as used in...
Alabama Learning Exchange
Alex: M&m's and Blogs: Interpreting Data!
In this hands-on, technology-rich lesson, students will interpret data. The students will define words involving graphs, create a bar graph using M&M's, and post information from their findings on the internet. The students will also...
University of Cambridge
University of Cambridge: Maths and Sports: David and Goliath
Does weight give shot putters an advantage? This activity encourages students to engage in statistical analysis, and is aimed at GCSE and A-level students (Key Stages 4 and 5).
Shodor Education Foundation
Shodor Interactivate: Lesson: Fire!, Probability, and Chaos
Students will simulate the probability of a forest fire then graphing the data.
Cuemath
Cuemath: Frequency Distribution Table
A comprehensive guide for learning all about frequency distribution tables with definitions, how to create a frequency distribution table, and the formulas and graphs related to frequency distributions. With solved examples and...
Education Development Center
Math Partners: Statistics and Probability [Pdf]
Comprehensive unit that consists of lessons and activities designed to help students learn statistics and probability concepts.
Wolfram Research
Wolfram Math World: World's Most Extensive Mathematics Resource
MathWorld provides a huge mathematics encyclopedia detailing the concepts of geometry, algebra, calculus, discrete math, number theory, and other math topics--complete with formulas, diagrams, examples, and references for thorough...
ClassFlow
Class Flow: Probability Spinner Handling Data
[Free Registration/Login Required] Students construct a probability spinner and then test, graph and analyze their data.
The Math League
The Math League: Ratio and Proportion
This tutorial provides definitions and examples of ratios and proportions and features comparing ratios and converting rates.
Texas Instruments
Texas Instruments: Statistical Graphs & Economics
What types of statistical graphs are there and when and how are they used and read? How are statistical graphs used in Economics?
Khan Academy
Khan Academy: Clusters, Gaps, Peaks, and Outliers
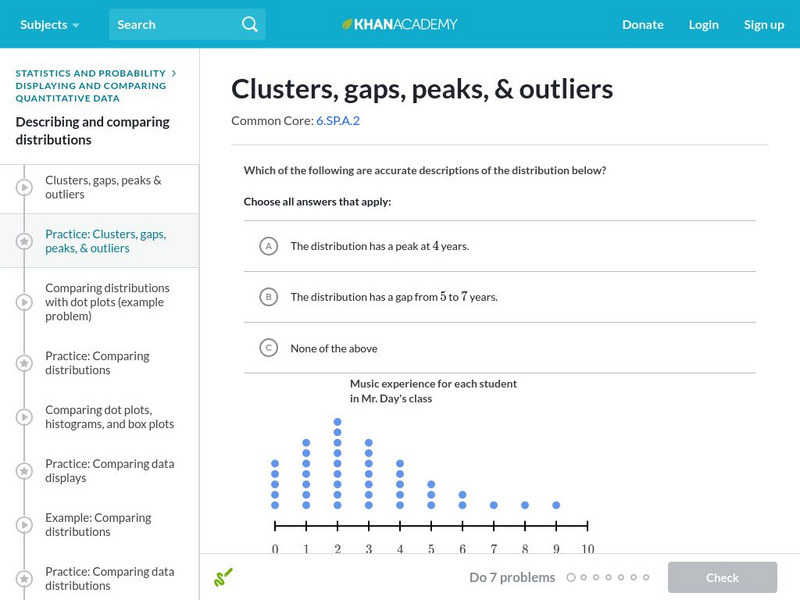
In this exercise, students practice describing data distributions as clusters, gaps, peaks, and outliers. Students receive immediate feedback and have the opportunity to get hints and try questions repeatedly.
Other
Resilience: Increasing Global Nonrenewable Natural Resource Scarcity Analysis
A detailed analysis of how nonrenewable resources will not disappear but will become increasingly scarce in the years to come. Supported by research data, graphs, and tables on the scope of nonrenewable resources, and how much we have of...
CK-12 Foundation
Ck 12: Statistics: Interpretation of Circle Graphs Grade 7
[Free Registration/Login may be required to access all resource tools.] Interpret circle graphs by using given data.
Texas Instruments
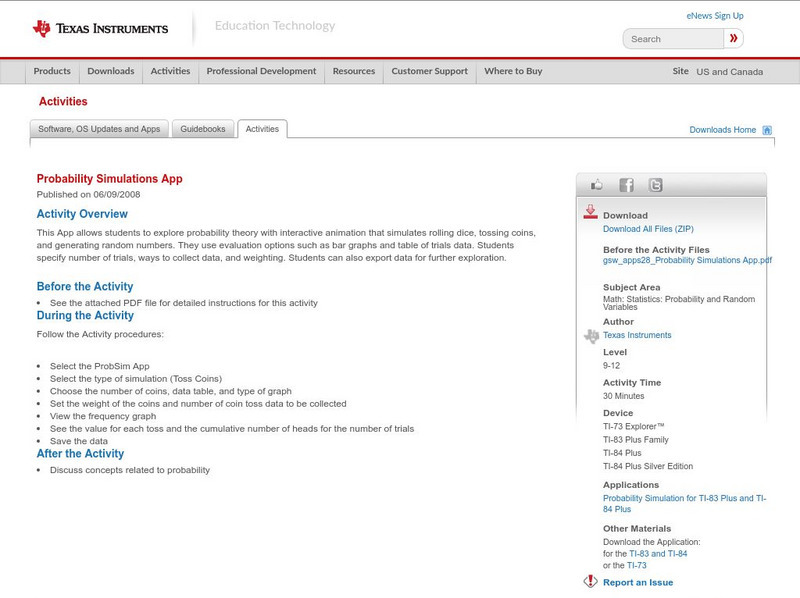
Texas Instruments: Probability Simulations App
This App allows students to explore probability theory with interactive animation that simulates rolling dice, tossing coins, and generating random numbers. They use evaluation options such as bar graphs and table of trials data....


