Hi, what do you want to do?
EngageNY
TASC Transition Curriculum: Workshop 12
How can opinions slant facts? Workshop participants learn how to examine primary and secondary sources and identify the author's point of view. They also examine how visual art impacts the meaning and rhetoric of sources. Full of...
Texas Education Agency
Texas Gateway: Informational Text: Synthesize Information in Charts and Graphs
In this lesson, you will learn how to understand the data found in charts and graphs, and at the end of the lesson, you will practice what you have learned.
Texas Education Agency
Texas Gateway: Synthesize Information in Charts and Graphs (English Ii Reading)
Synthesize information that you find in charts and graphs.
Quia
Quia: Reading Charts and Graphs Quiz
This 25-question quiz asks students to read various kinds of charts and graphs and to select the correct answers to the questions. Immediate feedback is provided after each question. Java is required.
Education Development Center
Tune in to Learning: Reading Charts and Graphs
Practice graph reading skills with these exercises and companion tutorials.
Texas Education Agency
Texas Gateway: Synthesize Information in Charts and Graphs (English Ii Reading)
Synthesize information that you find in charts and graphs.
Grammarly
Grammarly Handbook: Visuals: Graphs, Charts, and Diagrams
This article explains that graphs, charts, and diagrams are used to display information visually. The choice of what type of graph or chart to use depends on the information to be displayed. Software programs make these much easier to...
Other
The Topic: Charts and Graphs
Brief descriptions of charts and graphs, followed by links to larger sites on the same subject.
Lumen Learning
Lumen: Critical Reading: Specialized Reading Strategies
This lesson focuses on specialized reading strategies such as online reading, reading in math, science, etc., and reading charts and graphs. It provides text, videos, charts and graphs, graphics, and a self-check.
California State University
Reading Strategies From the University of Waterloo
Brief and easy to read, this California State University Northridge site lists strategies for getting the most of your reading. Geared for reading texts and technical material.
Texas Education Agency
Texas Gateway: Evaluating Data in Tables, Graphs and Charts
[Accessible by TX Educators. Free Registration/Login Required] In this lesson students look at examples of graphics, tables, charts, and graphs, and learn how to interpret their data. They will be able to use this skill to enhance their...
Texas Education Agency
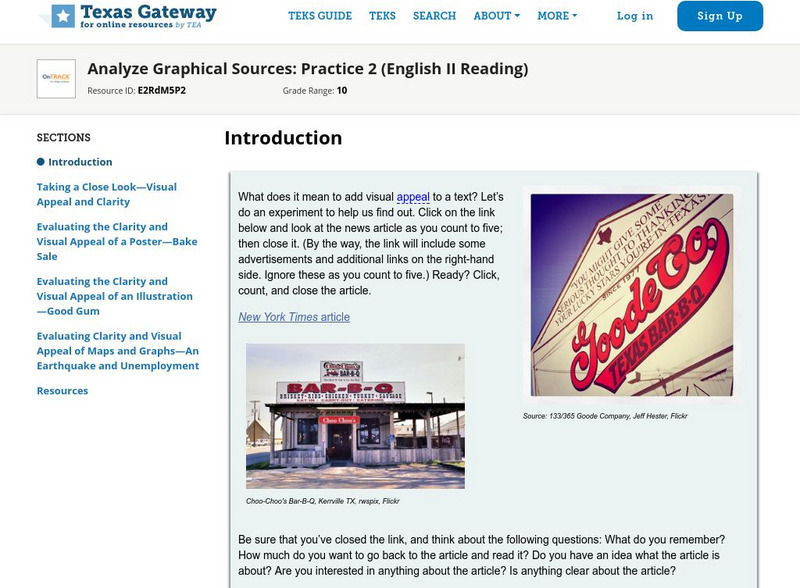
Texas Gateway: Analyze Graphical Sources: Practice 2 (English I Reading)
This lesson focuses on practice exercises to understand and interpret the data in a graphic representations including pie charts, bar graphs, and line graphs.
Utah Education Network
Uen: Balanced Diet
In this lesson, 2nd graders will learn about the components of a balanced diet. Students will analyze charts and then self-report their own foods in categories. Several fiction and nonfiction books are listed as additional resources.
Texas A&M University
Wtamu Virtual Math Lab: Beginning Algebra: Reading Graphs
A good introduction to reading bar, line, and double line graphs, and drawing and reading Venn diagrams. Contains definitions and examples of these types of charts and graphs as well as practice exercises that ask you to answer questions...
Khan Academy
Khan Academy: Read Histograms
Practice reading and interpreting histograms. Students receive immediate feedback and have the opportunity to try questions repeatedly, watch a video or receive hints.
Read Works
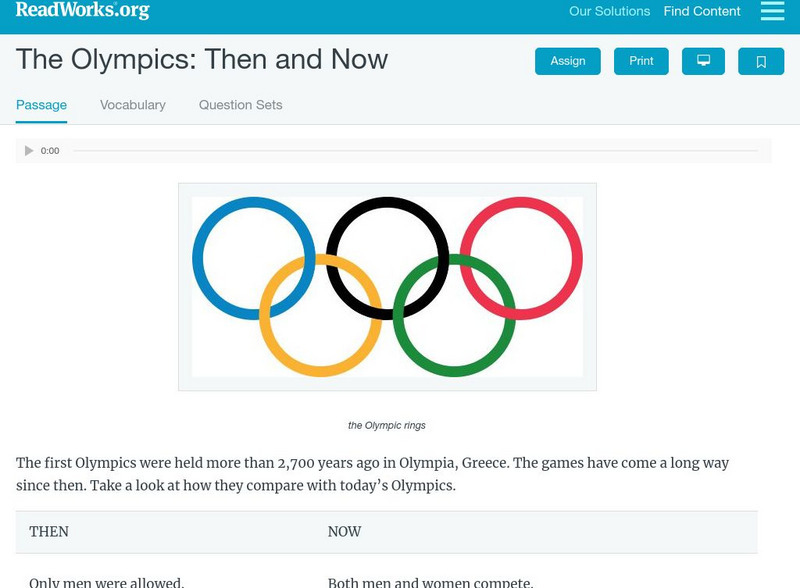
Read Works: The Olympics Then and Now
[Free Registration/Login Required] Students read two charts with information about the Olympics in ancient Greece and in modern times. A question sheet is available to help students build skills in comparing and contrasting.
Texas Education Agency
Texas Gateway: Analyze Graphical Sources: Practice 2 (English Ii Reading)
[Accessible by TX Educators. Free Registration/Login Required] Analyze the factual, quantitative, and technical data in graphs and charts.
National Center for Ecological Analysis and Synthesis, University of California Santa Barbara
Ucsb / Pie Graphs (Piece of Cake)
This page gives an example and easy-to-understand description of a pie graph (circle graph.) Also provides an opportunity for students to test their abilities to read a pie graph.
Khan Academy
Khan Academy: Reading Dot Plots & Frequency Tables
Practice reading basic dot plots and frequency tables. Students receive immediate feedback and have the opportunity to try questions repeatedly, watch a video or receive hints.
Read Works
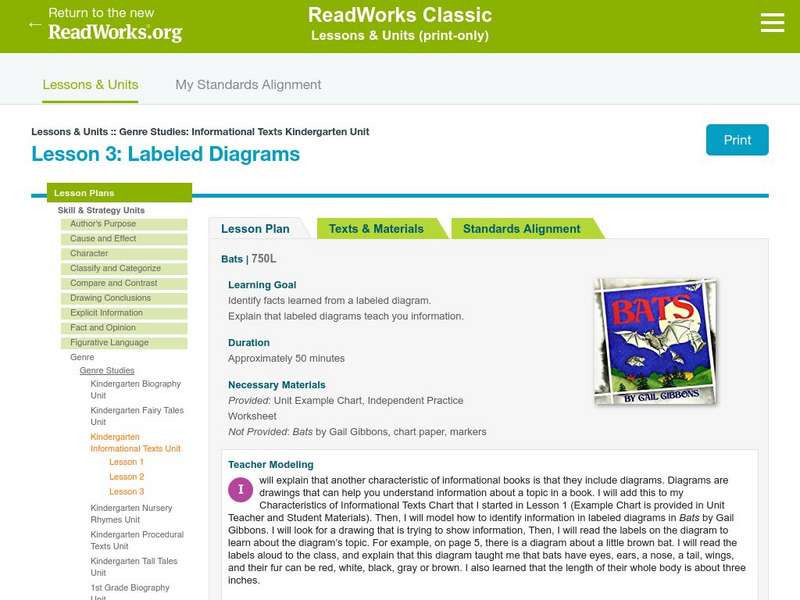
Read Works: Genre Studies: Informational Text Kindergarten Unit: Labeled Diagrams
[Free Registration/Login Required] Lesson uses Bats by Gail Gibbons to teach students how to identify facts learned from labeled diagrams within an informational text. Ideas for direct teaching, guided practice, and independent practice...
Read Works
Read Works: The Middle Ages Feudalism in the Middle Ages
[Free Registration/Login Required] An informational text about feudalism and how it provided stability during the Middle Ages. A question sheet is available to help students build skills in reading comprehension.
Khan Academy
Khan Academy: The Sat Reading Test: Overview
This is an overview of what to expect on the SAT Reading Test. It assesses your ability to read and interpret a variety of texts similar to the reading you will find in college and your career. All of the questions on the reading test...
Colorado State University
Colorado State Writing Center: Charts
The use of charts and graphs can improve your presentations, whether on paper or as visual aids. Here you can read about how to create line, column, bar, pie graphs, and scatterplots. Just follow the links to their respective pages.
Other
Super Teacher Worksheets: Reading Comprehension: Hurricanes [Pdf]
Read the fifth-grade reading passages and charts about hurricanes by Erin Ryan and answer the comprehension questions over the selections. PDF includes an answer key with explanations.


