Khan Academy
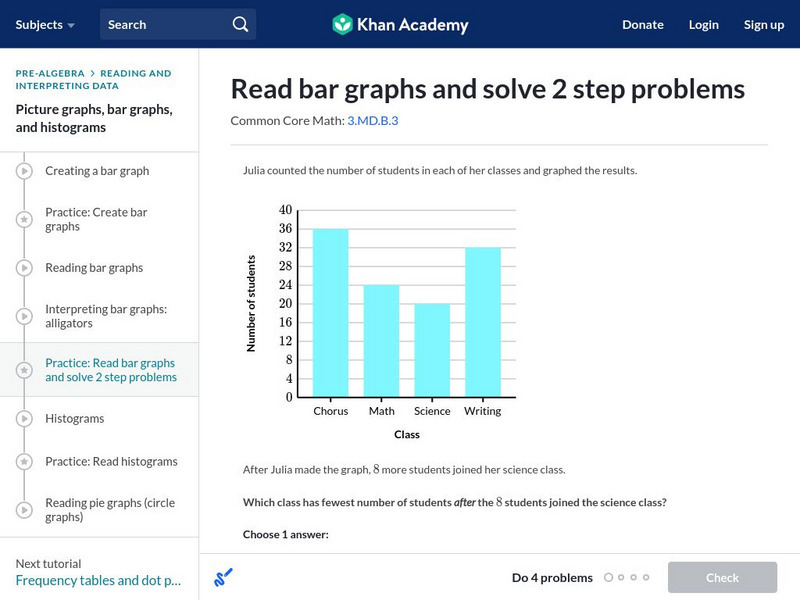
Khan Academy: Read Bar Graphs and Solve 2 Step Problems
Read and interpret a double bar graphs. Students receive immediate feedback and have the opportunity to try questions repeatedly, watch a video or receive hints. CCSS.Math.Content.3.MD.B.3 Draw a scaled picture graph and a scaled bar...
Khan Academy
Khan Academy: Read Picture Graphs (Multi Step Problems)
Interpret picture graphs to answer questions about a context. Students receive immediate feedback and have the opportunity to try questions repeatedly, watch a video or receive hints.
Khan Academy
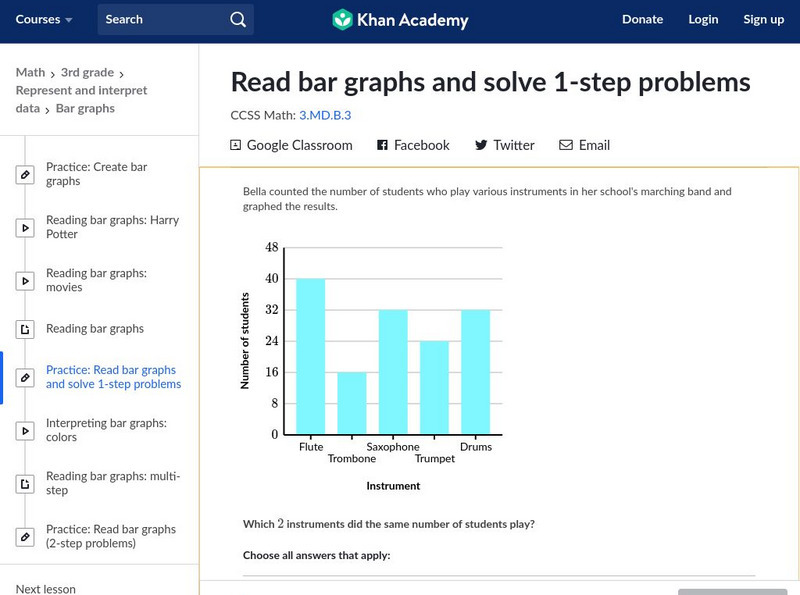
Khan Academy: Read Bar Graphs and Solve 1 Step Problems
Interpret bar graphs to answer questions about a context. Students receive immediate feedback and have the opportunity to try questions repeatedly, watch a video or receive hints.
McGraw Hill
Glencoe: Self Check Quizzes 1 Circle Graphs
Use Glencoe's randomly generated self-checking quiz to test your knowledge of circle graphs. Each question has a "Hint" link to help. Choose the correct answer for each problem. At the bottom of the page click the "Check It" button and...
Khan Academy
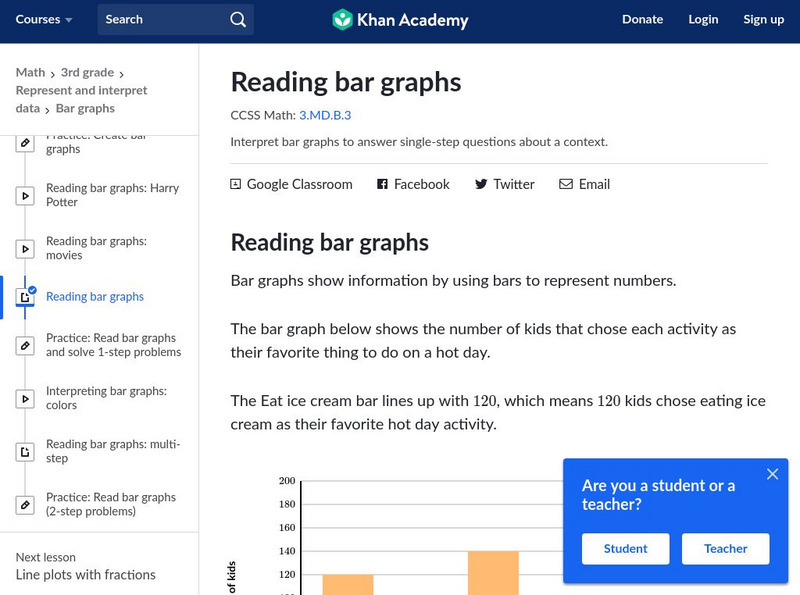
Khan Academy: Reading Bar Graphs
Explains what bar graphs are, their uses, and presents practice problems for creating a bar graph and answering questions about them. Problems are accompanied by detailed solutions.
Khan Academy
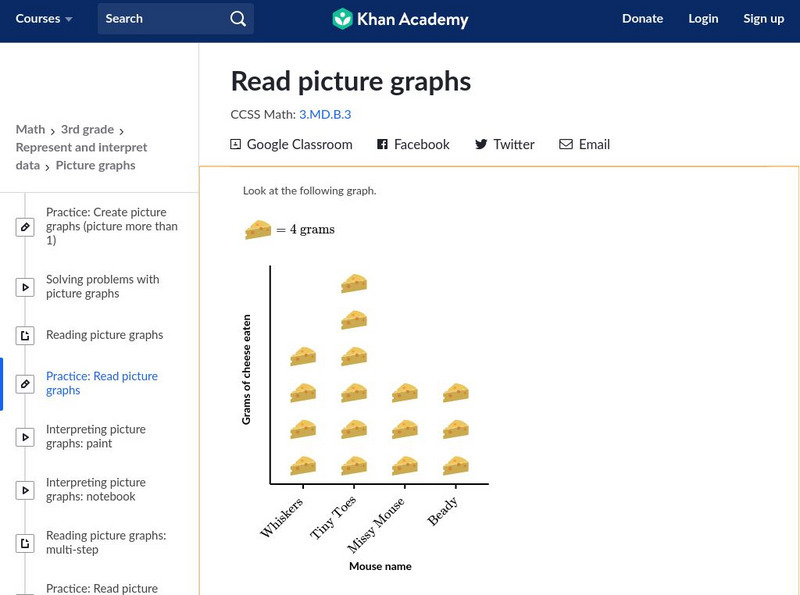
Khan Academy: Read Picture Graphs
Use picture graphs to solve word problems. Students receive immediate feedback and have the opportunity to try questions repeatedly, watch a video or receive hints. CCSS.Math.Content.3.MD.B.3 Draw a scaled picture graph and a scaled bar...
Lumen Learning
Lumen: Critical Reading: Specialized Reading Strategies
This lesson focuses on specialized reading strategies such as online reading, reading in math, science, etc., and reading charts and graphs. It provides text, videos, charts and graphs, graphics, and a self-check.
Utah Education Network
Uen: Chicken Pox Math
Students will engage in a shared reading of Itchy, Itchy Chicken Pox by Grace Maccarone, Arthur's Chicken Pox by Marc Brown, or Turkey Pox by Laurie Anderson. Students will discuss the text and then engage in several math-related tasks...
Khan Academy
Khan Academy: Bar Graphs Review
Bar graphs are a nice way to visualize categorical data. This article reviews how to create and read bar graphs.
Khan Academy
Khan Academy: Picture Graphs (Pictographs) Review
Picture graphs are a fun way to display data. This article reviews how to create and read picture graphs (also called pictographs).
E-learning for Kids
E Learning for Kids: Math: Orange Trees, Olive Trees: Line Graphs
Explore even and odd numbers, fractions, counting, and line graphs with Scott amidst the olive and orange trees.
Primary Resources
Primary Resources: Tally and Bar Charts
Lots of good materials for teaching about tally marks and bar graphs.
Khan Academy
Khan Academy: Interpreting Graphs of Proportional Relationships
Practice reading and analyzing graphs of proportional relationships. Students receive immediate feedback and have the opportunity to try questions repeatedly, watch a video or receive hints.
Khan Academy
Khan Academy: Solve Problems With Bar Graphs 1
Read and interpret bar graphs. Students receive immediate feedback and have the opportunity to try questions repeatedly, watch a video or receive hints.
E-learning for Kids
E Learning for Kids: Math: Dinosaurs: Data and Chance
Students can play learning games to explore how to label, read, and create graphs using a dinosaur theme.
Education Place
Houghton Mifflin: Eduplace: Make a Living Bar Graph
Student use simple data to line up in a living bar graph activity when they respond to simple questions in this lesson plan. They physically and visually represent the data. CCSS.Math.Content.3.MD.B.3 Draw a scaled picture graph and a...
University of Cambridge
University of Cambridge: Nrich: The Pet Graph
On this one-page website, sharpen your logic and graph reading skills by figuring out which pet goes with each bar on the graph. The solution is available to double check your own solution.
Primary Resources
Primary Resources: Line Graphs and Pie Charts
Here are a few resources to use with your students when teaching about line graphs or pie charts.
Rice University
Rice University: Cynthia Lanius: Interpreting Graphs: The Hot Tub
The graph of the water level of a hot tub is presented and students are asked to tell the story of how the water level changes. Explanations of slope and functions accompany the problem.
Other
Basket Math Interactive
Explore more than twenty math concepts such a perimeter, rounding, exponents, decimals, sign numbers, and more using this interactive basketball game. A Spanish version is also offered. Students results are tabulated daily.
National Council of Teachers of Mathematics
The Math Forum: Urban Systemic Initiative/oceans of Data
This site includes questions related to reading and understanding graphs. There are links on this site to lesson plans, benchmarks, and other webpages all of which mostly center about probability and statistics.
Wolfram Research
Wolfram Math World: Function
Site offers a definition of a function. This definition may be difficult to grasp if you are not familiar with the mathematical language, however if you carefully read the definition, examples, and go to related links for unfamiliar...
Texas A&M University
Wtamu Virtual Math Lab: Beginning Algebra: Reading Graphs
A good introduction to reading bar, line, and double line graphs, and drawing and reading Venn diagrams. Contains definitions and examples of these types of charts and graphs as well as practice exercises that ask you to answer questions...
Khan Academy
Khan Academy: Read Line Plots (Data With Fractions)
Practice reading and interpreting data that is graphed on line plots. The data graphed includes fractions. Students receive immediate feedback and have the opportunity to try questions repeatedly, watch a video or receive hints....
