Hi, what do you want to do?
College Board
AP® Psychology: Teaching Statistics and Research Methodology
Psychologists use statistics? Scholars investigate the research behind the methodology of statistical analysis. Using hands-on practice, case-studies, and scatterplots, they complete various tasks to understand the very roots of high...
NASA
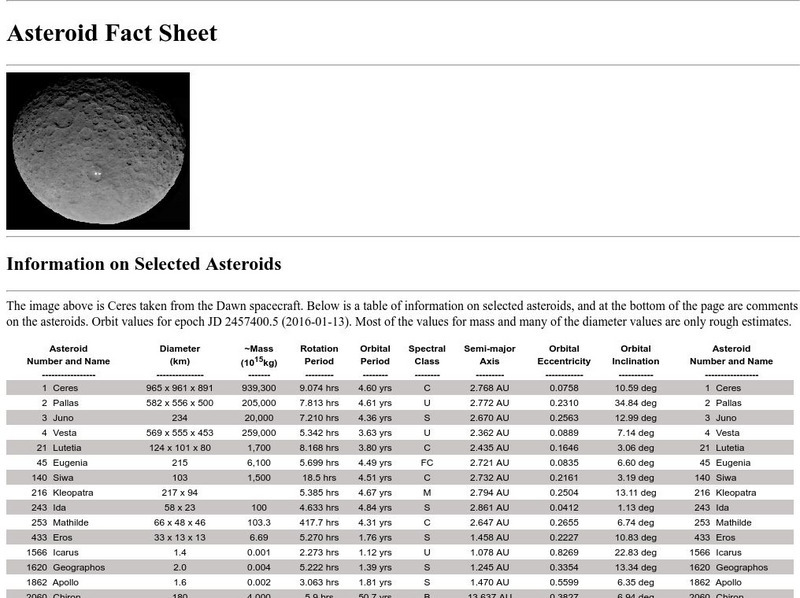
Nasa Space Science Data Archive: Asteroid Fact Sheet
This asteroid fact sheet, supplied by the National Space Science Data Center, provides a table of information on selected asteroids, complete with commentary when appropriate.
University of Utah
University of Utah: Genetic Science Learning Center: teach.genetics: Introduction to Heredity
A three-day unit introduces heredity by helping students identify their own genetic traits and then leading them in an exploration of generational traits and variation. Find printable worksheets, data tables, and graphs, as well as...
Discovery Education
Discovery Education: Science Fair Central: Investigation Set Up and Collect Data
A brief overview of how to gather both quantitative and qualitative data, complete with a sample data table.
NASA
Nasa Space Science Data Archive: Neptunian Rings Fact Sheet
A data table of nearly everything known about the ring system of Neptune. The resource also includes an image of the rings of Neptune that can be enlarged.
Palomar Community College District
Palomar College: Behavioral Science Statistics: Cumulative Percent Polygon
A step-by-step worked problem demonstrating how to take a set of data and produce a cumulative percent polygon. Hints are provided along the way, and the final graph is shown for the user to check.
National Center for Ecological Analysis and Synthesis, University of California Santa Barbara
Kids Do Ecology: Data and Science
Learn about conducting your own investigation with these tips on following the scientific method. Find out how to state hypothesis, make observations, collect and analyze data, and display data to share results and conclusions of your...
NASA
Nasa Space Science Data Archive: Neptunian Satellite Fact Sheet
A pair of small tables of data that contain just about everything known about the moons of Neptune.
NASA
Nasa Space Science Data Archive: Comet Fact Sheet
This comet fact sheet, supplied by the NSSDC, provides a table of information on selected comets, complete with commentary when appropriate. Includes details of missions to observe these comets.
Science Buddies
Science Buddies: Data Analysis for Advanced Science Projects
The importance of data analysis in science projects is explained. Describes common mistakes young scientists make. The article then discusses how to find out what the standard methods of data analysis are for the type of research you...
National Science Foundation
National Science Foundation: State Support for Higher Education Per Full Time Equivalent Student
The interactive map on this page displays the amount spent by each states on public universities, excluding special purpose appropriations. The statistics are searchable by state for each year between 2000 and 2020. Data is also...
Concord Consortium
Concord Consortium: Stem Resources: Relative Humidity Measurement
Using the wet bulb-dry bulb method, students will compare the temperature of a dry temperature sensor and a wet temperature sensor. By comparing the temperatures, students will be able to find the relative humidity. After completing the...
Alabama Learning Exchange
Alex: Ice Cream Sundae Survey
Students quickly realize the importance of learning how to read and find information in charts, graphs, and tables compared to finding the same information written in a paragraph. This is a fun, high energy lesson!This lesson plan was...
Other
Kindergarten lessons.com: Graphing Activities
Graphing activities for preschool and kindergarten include collecting data and organizing it in a variety of ways. There are lots of fun things to do in this area of math and the activities integrate well with science and literacy...
Alabama Learning Exchange
Alex: Representing Possibilities
The students will work through problems that will be represented in tables, equations, and graphs. This instructional activity was adapted from NCTM Student Math Notes, May/June 2007.This lesson plan was created as a result of the Girls...
Web Elements
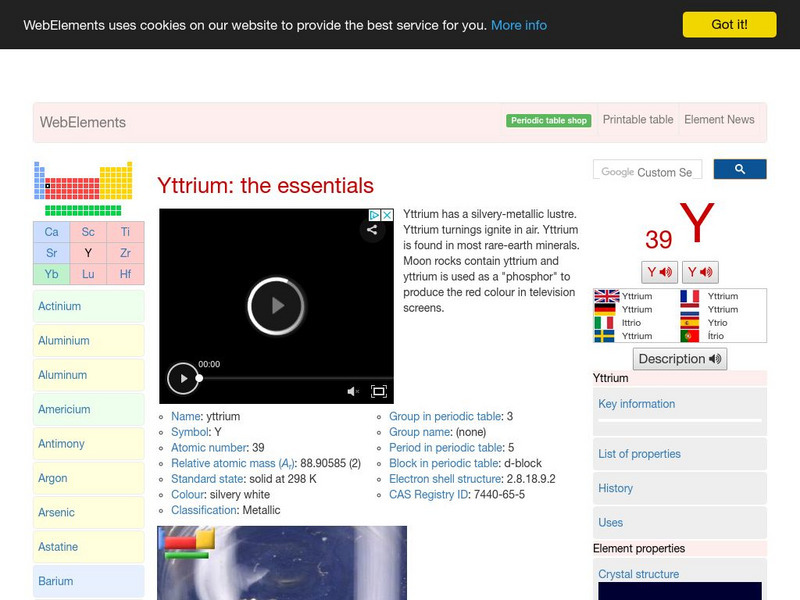
Web Elements Periodic Table: Yttrium
At this site from Mark Winter at WebElement, you can navigate around for charts and graphs of data on Yttrium. Probably the most comprehensive of all periodic tables on the web.
Khan Academy
Khan Academy: Life Tables, Survivorship, & Age Sex Structure
This article describes tools ecologists use to describe the present state of a population and predict its future growth.
Other
New Path Learning: Virtual Lab: Exploring Pulleys
Investigate how changing the load, number of pulleys, and the size of the person affect the function of a pulley system. Students can record their observations on a data table.
Alabama Learning Exchange
Alex: Incline Plane and the Crashing Marble
Students will measure the effects of the height of an inclined plane on the force a marble produces to move a plastic, foam, or paper cup across a table. Students will discover that the higher the incline plane, the more force produced...
Annenberg Foundation
Annenberg Learner: The Habitable Planet: Disease Lab
Manipulate characteristics of fictional diseases and see how the changes effect a population. Simulator includes a data table available for download for student records.
Annenberg Foundation
Annenberg Learner: The Habitable Planet: Ecology Lab
Create the parameters of your own ecosystem by choosing which producers and consumers live there. Visualize how the food web operates and species populations change. This simulator mimics the food web within a typical ecosystem and gives...
Bio Topics
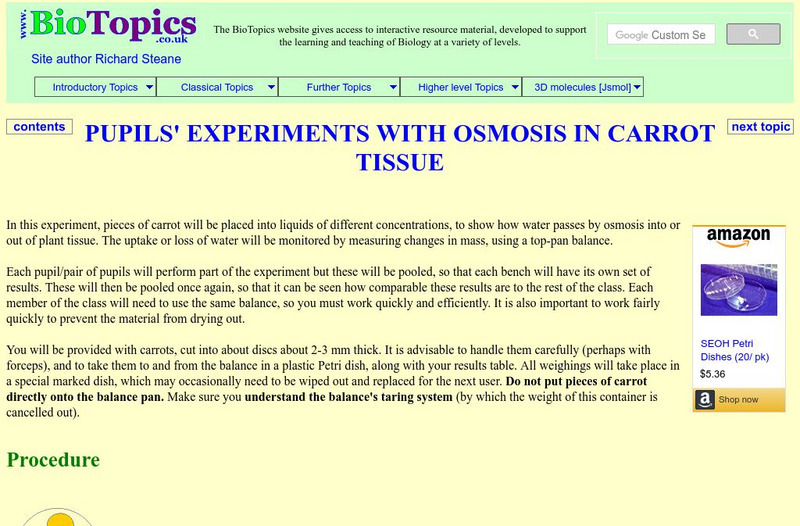
Bio Topics: Pupils' Experiments With Osmosis in Carrot Tissue
An experiment that demonstrates the process of osmosis with pieces of carrots. Experiment includes procedure, data table, and post lab questions.
Annenberg Foundation
Annenberg Learner: The Habitable Planet: Carbon Lab
An interactive lab simulation demonstrates the effects of increased carbon in the atmosphere and how that increase contributes to climate change. A data table for student records is available for download.
Alabama Learning Exchange
Alex: My Peanut Butter Is Better Than Yours!
The students will engage in the process of statistical data comparing data using tables and scatterplots. The students will compare data using measures of center (mean and median) and measures of spread (range). This lesson can be done...


