Hi, what do you want to do?






Texas Instruments
Texas Instruments: Circular Functions
In this activity, students find intercepts of circular function graphs. They also investigate the characteristics of such graphs.
Texas Instruments
Texas Instruments: Grandparents and Special Friends Day
This lesson was designed for our Grandparents and Special Friends day. It can be used for any visitation day, or an open house. The lesson is designed to review percent of a whole and the sector of the circle representing the percentage....

Texas Instruments
Texas Instruments: Math Today the Next Frontier for Flight
This activity provides students the opportunity to gain experience in creating circle graphs on the calculator and provides an excellent real-world review of computation with percents.
Texas Instruments
Texas Instruments: Picturing Probabilities of Number Cube Sums
Students use ideas of ratio and proportion to investigate various ways to make a circle graph. Students create graphs to display the probabilities of the different sums that can be generated with two number cubes. [Requires Adobe Reader.]
Texas Instruments
Texas Instruments: Mc Dougal Littell Algebra 2: Graph Equations of Circles
Students can use the TI-84 Plus family to graph equations of circles.
Texas Instruments
Texas Instruments: Match the Graph (Circles)
Students will learn about the equation for a circle by using a Study Cards stack. Later, students will attempt to match the graph of a circle from a digital picture, using the form learned previously, and approximating the center and...
Texas Instruments
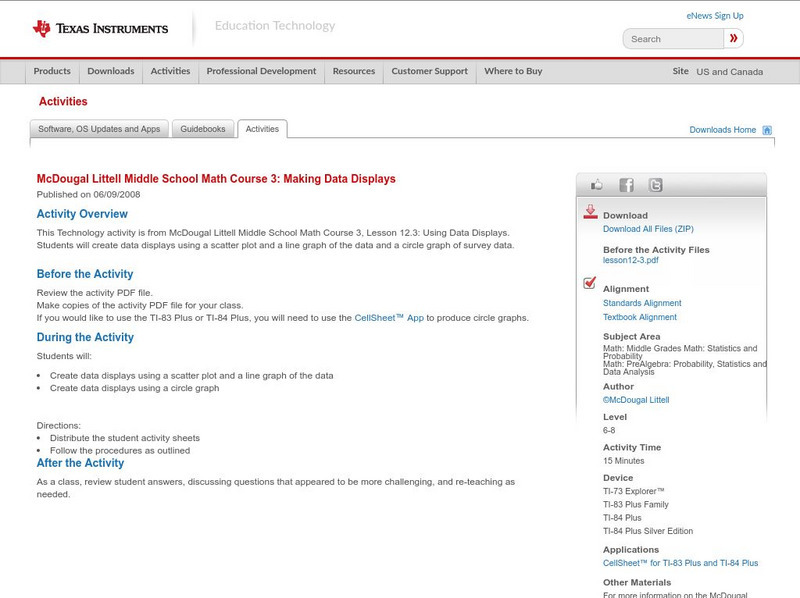
Texas Instruments: Mc Dougal Littell Middle School Math: Making Data Displays
Students will create data displays using a scatter plot and a line graph of the data and a circle graph of survey data.

Texas Instruments
Texas Instruments: Exploring Geometric Probability Using Ti Navigator
In this activity students will contribute a set of random points to a graph of a circle of radius 1 inscribed in a square. They will estimate the area of the circle using geometric probability.
Texas Instruments
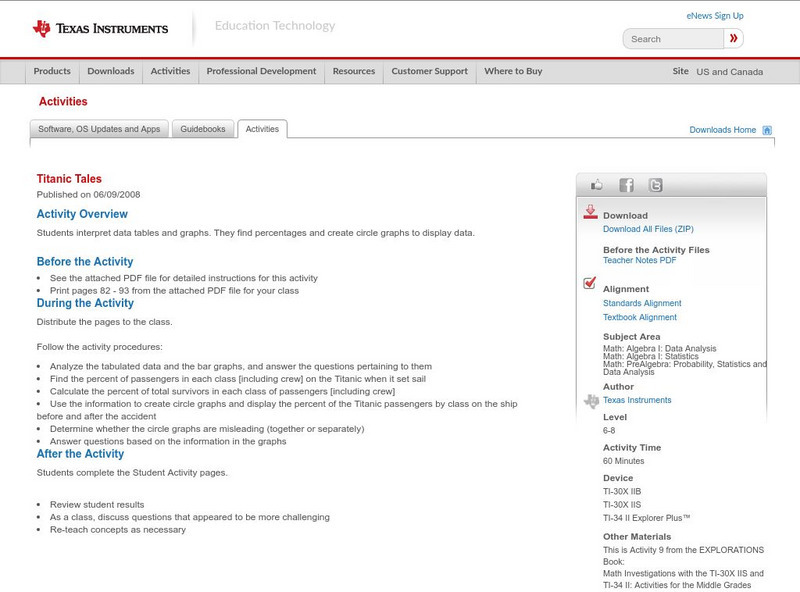
Texas Instruments: Titanic Tales
In this activity, students interpret data tables and graphs. They find percentages, and create circle graphs to display data.
Texas Instruments
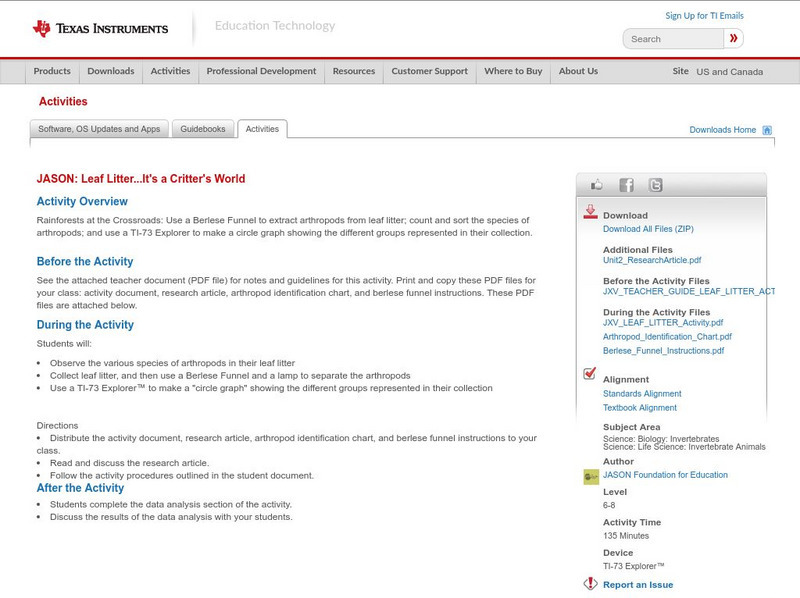
Texas Instruments: Jason: Leaf Litter, It's a Critter's World
Rainforests at the Crossroads: Use a Berlese Funnel to extract arthropods from leaf litter; count and sort the species of arthropods; and use a TI-73 Explorer to make a circle graph showing the different groups represented in their...
Texas Instruments
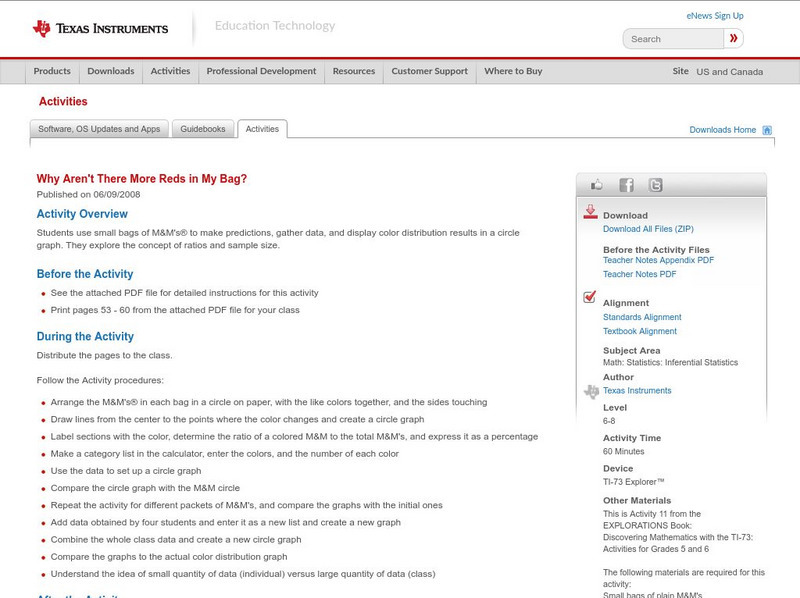
Texas Instruments: Why Aren't There More Reds in My Bag?
Students use small bags of M&M's to make predictions, gather data, and display color distribution results in a circle graph. They explore the concept of ratios and sample size.
Texas Instruments
Texas Instruments: Approximation of Pi
Students will measure the circumference and diameter of a variety of different circles. They will graph the class' values of (d,c) on the coordinate plane and use linear regression to approximate pi.
Texas Instruments
Texas Instruments: Conic Equations
This Learn Check file is a review of writing conic sections given the graph of a conic section. Students are asked to use the graphs to write the equations for a ellipse, circle, parabola, and hyperbola.